You can construct some financial ratios, such as P/E Ratio or P/B.
P/E Ratio
P/E Ratio stands for Price/Earnings. As Price you can use the market value of equity and for Earnings the Total Net Profit from firm's Income Statement. Equivalently, you can divide both measures with the outstanding shares. This way P/E Ratio stands for Stock Price/EPS.
An example: Suppose that XYZ Corporation belongs in the Utility Sector. The industry P/E Ratio equals 10. XYZ has a P/E Ratio of 30. Should we buy or sell XYZ Stock?
$P/E=30$, translates to "Investors are willing to pay 30\$ for each 1$ of XYZ earnings" Stock is overvalued compared to industry's P/E Ratio, as "Investors are willing to pay 10\$ for each 1\$ of industry earnings". XYZ is a growth stock, since other companies are traded at x10 P/E Multiple, and should be sold.
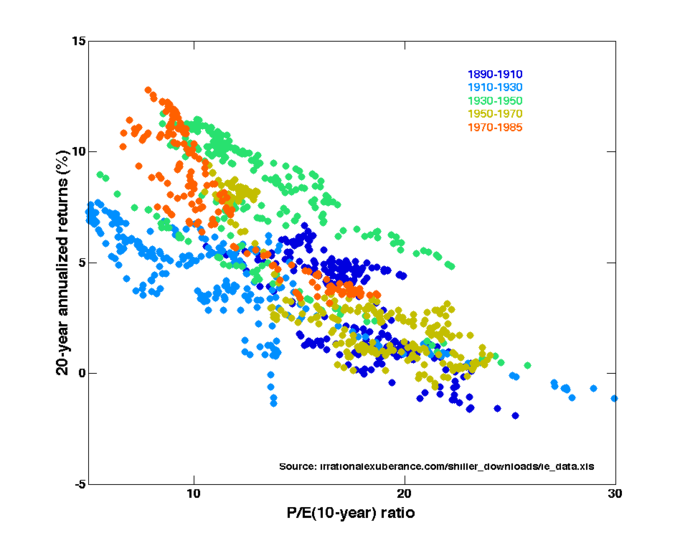
Rule of Thumb: P/E Ratio is Low compared to industry (Value stock) : Buy signal
               P/E Ratio is High compared to industry (Growth stock): Sell signal
[![enter image description here][1]][1]
P/B Ratio
Stand for Price/Book Value. Market value of equity is divided by the Book value of equity(Total Shareholder's Equity, extracted from firm's balance sheet). Equivalently, you can divide both measures by the total shares outstanding. A high P/B ratio indicates expensive stock, since market value exceeds the book value. A low P/B ratio indicated a company with an "expensive" balance sheet.
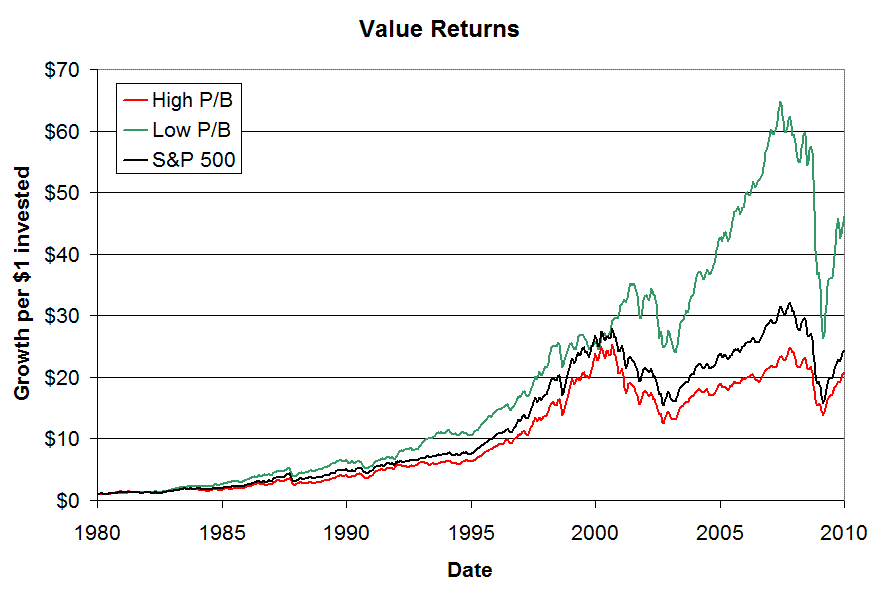
Rule of Thumb: P/B Ratio is Low compared to industry: Buy signal
               P/B Ratio is High compared to industry: Sell signal
[![][2]][2] Source: http://www.stingyinvestor.com/SI/articles/MS1010b.shtmlhttp://www.stingyinvestor.com/SI/articles/MS1010b.shtml
Note that these discrimination rules refer to relationship among averages (not a deterministic rule). Also, note that these ratios are affected by accounting standards (how firm treats it's assets, revenues, expenses and so on) and informationally might be biased. [1]: https://i.sstatic.net/f7TUw.png [2]: https://i.sstatic.net/xM0c5.png
