deleted 185 characters in body
Source Link
T123
  • 600
  • 5
  • 19

I do not have enough exposure to Markowitz and mean-variance optimization so please just take this more like a comment than a full answer but lacking of the latter i offer you my view: I remember that i saw an article using an numerical integral of the area below the efficient frontier to approximate the set of stochastically dominant portfolios for a given mean-variance combination of a given portfolio. As the paper correctly assumed that they cannot know the percise preferences and thus the optimal portfolios location ( and furthermore a riskfree asset wasn't available) the authors were trying to quantify the set of dominant portfolios as some sort of inefficiency measure, which takes the efficient frontier as a curve into account. Any changes in the covariance matrix and market parameters , which affect the efficient frontier as a function was taken into account by this integral, which seemed to be the right way to go from their standpoints. Please let me know if this is what you are looking for, then i will try to find my notes and perhaps the paper on this, ok?

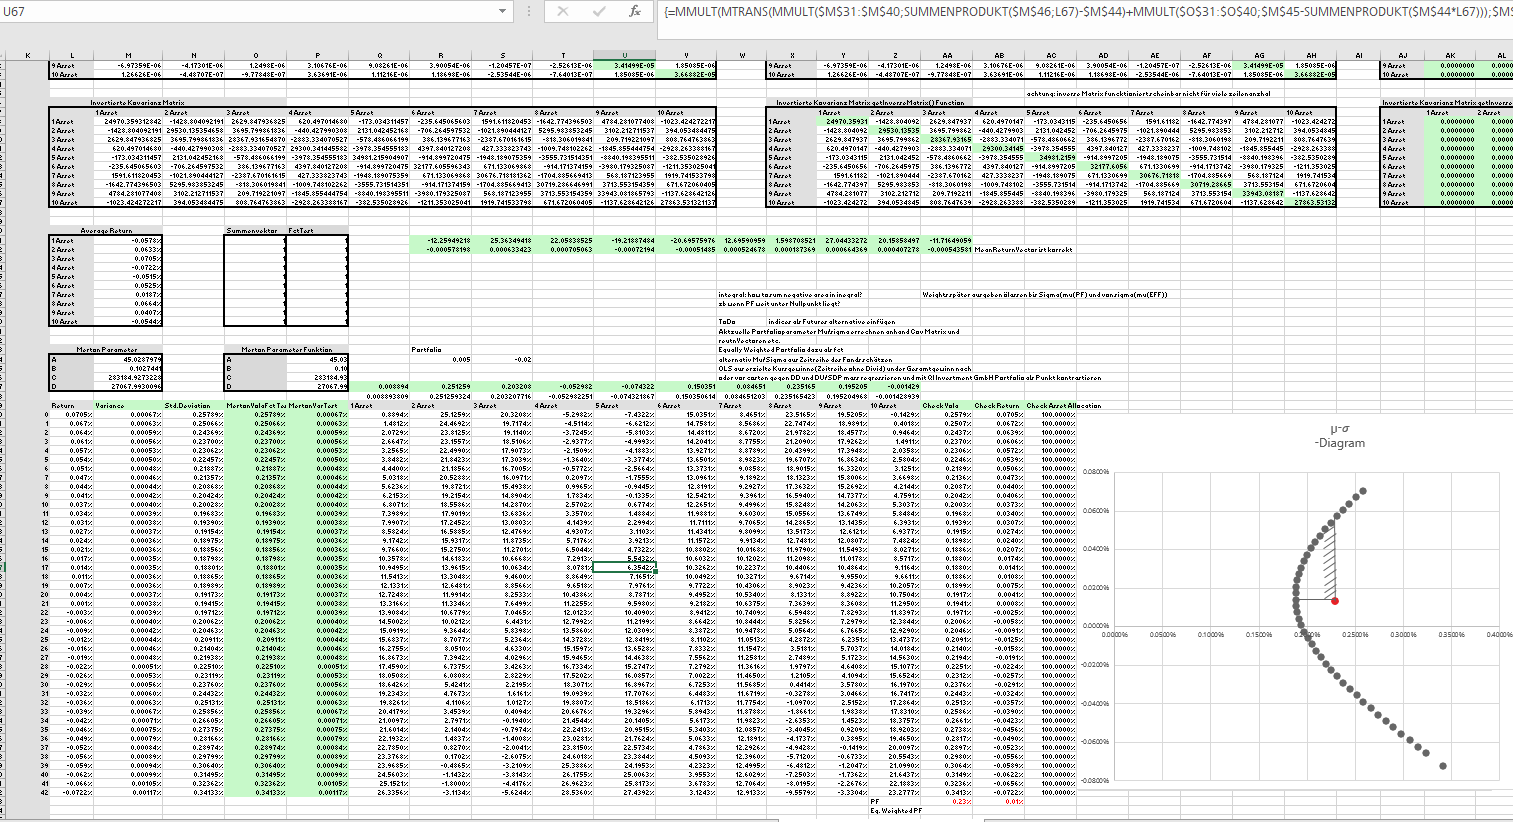
EDIT: I haven't found my notes but i managed to build a toymodel in VBA to play around a bit. The trick is you can use Merton(1972) for the efficient frontier and integrate between the efficient frontier and the portfolio (see the hatched area in my pic).enter image description here If I change the VarCov-matrix the integral changes as it determines the set of stochastically dominant portfolios as i mentioned above (values for the integral are plotted on the other tab (not included in this pic). Let me know if this helps you and whether this is what you were looking for. I guess its pretty similar to the other answer where you get the AuC by Gini.So both answers point in the same direction.

I remember that i saw an article using an numerical integral of the area below the efficient frontier to approximate the set of stochastically dominant portfolios for a given mean-variance combination of a given portfolio. As the paper correctly assumed that they cannot know the percise preferences and thus the optimal portfolios location ( and furthermore a riskfree asset wasn't available) the authors were trying to quantify the set of dominant portfolios as some sort of inefficiency measure, which takes the efficient frontier as a curve into account. Any changes in the covariance matrix and market parameters , which affect the efficient frontier as a function was taken into account by this integral, which seemed to be the right way to go from their standpoints. Please let me know if this is what you are looking for, then i will try to find my notes and perhaps the paper on this, ok?

EDIT: I haven't found my notes but i managed to build a toymodel in VBA to play around a bit. The trick is you can use Merton(1972) for the efficient frontier and integrate between the efficient frontier and the portfolio (see the hatched area in my pic).enter image description here If I change the VarCov-matrix the integral changes as it determines the set of stochastically dominant portfolios as i mentioned above (values for the integral are plotted on the other tab (not included in this pic). Let me know if this helps you and whether this is what you were looking for. I guess its pretty similar to the other answer where you get the AuC by Gini.So both answers point in the same direction.

added 639 characters in body
Source Link
T123
  • 600
  • 5
  • 19

I do not have enough exposure to Markowitz and mean-variance optimization so please just take this more like a comment than a full answer but lacking of the latter i offer you my view: I remember that i saw an article using an numerical integral of the area below the efficient frontier to approximate the set of stochastically dominant portfolios for a given mean-variance combination of a given portfolio. As the paper correctly assumed that they cannot know the percise preferences and thus the optimal portfolios location ( and furthermore a riskfree asset wasn't available) the authors were trying to quantify the set of dominant portfolios as some sort of inefficiency measure, which takes the efficient frontier as a curve into account. Any changes in the covariance matrix and market parameters , which affect the efficient frontier as a function was taken into account by this integral, which seemed to be the right way to go from their standpoints. Please let me know if this is what you are looking for, then i will try to find my notes and perhaps the paper on this, ok?

EDIT: I haven't found my notes but i managed to build a toymodel in VBA to play around a bit. The trick is you can use Merton(1972) for the efficient frontier and integrate between the efficient frontier and the portfolio (see the hatched area in my pic).enter image description here If I change the VarCov-matrix the integral changes as it determines the set of stochastically dominant portfolios as i mentioned above (values for the integral are plotted on the other tab (not included in this pic). Let me know if this helps you and whether this is what you were looking for. I guess its pretty similar to the other answer where you get the AuC by Gini.So both answers point in the same direction.

I do not have enough exposure to Markowitz and mean-variance optimization so please just take this more like a comment than a full answer but lacking of the latter i offer you my view: I remember that i saw an article using an numerical integral of the area below the efficient frontier to approximate the set of stochastically dominant portfolios for a given mean-variance combination of a given portfolio. As the paper correctly assumed that they cannot know the percise preferences and thus the optimal portfolios location ( and furthermore a riskfree asset wasn't available) the authors were trying to quantify the set of dominant portfolios as some sort of inefficiency measure, which takes the efficient frontier as a curve into account. Any changes in the covariance matrix and market parameters , which affect the efficient frontier as a function was taken into account by this integral, which seemed to be the right way to go from their standpoints. Please let me know if this is what you are looking for, then i will try to find my notes and perhaps the paper on this, ok?

I do not have enough exposure to Markowitz and mean-variance optimization so please just take this more like a comment than a full answer but lacking of the latter i offer you my view: I remember that i saw an article using an numerical integral of the area below the efficient frontier to approximate the set of stochastically dominant portfolios for a given mean-variance combination of a given portfolio. As the paper correctly assumed that they cannot know the percise preferences and thus the optimal portfolios location ( and furthermore a riskfree asset wasn't available) the authors were trying to quantify the set of dominant portfolios as some sort of inefficiency measure, which takes the efficient frontier as a curve into account. Any changes in the covariance matrix and market parameters , which affect the efficient frontier as a function was taken into account by this integral, which seemed to be the right way to go from their standpoints. Please let me know if this is what you are looking for, then i will try to find my notes and perhaps the paper on this, ok?

EDIT: I haven't found my notes but i managed to build a toymodel in VBA to play around a bit. The trick is you can use Merton(1972) for the efficient frontier and integrate between the efficient frontier and the portfolio (see the hatched area in my pic).enter image description here If I change the VarCov-matrix the integral changes as it determines the set of stochastically dominant portfolios as i mentioned above (values for the integral are plotted on the other tab (not included in this pic). Let me know if this helps you and whether this is what you were looking for. I guess its pretty similar to the other answer where you get the AuC by Gini.So both answers point in the same direction.

Source Link
T123
  • 600
  • 5
  • 19

I do not have enough exposure to Markowitz and mean-variance optimization so please just take this more like a comment than a full answer but lacking of the latter i offer you my view: I remember that i saw an article using an numerical integral of the area below the efficient frontier to approximate the set of stochastically dominant portfolios for a given mean-variance combination of a given portfolio. As the paper correctly assumed that they cannot know the percise preferences and thus the optimal portfolios location ( and furthermore a riskfree asset wasn't available) the authors were trying to quantify the set of dominant portfolios as some sort of inefficiency measure, which takes the efficient frontier as a curve into account. Any changes in the covariance matrix and market parameters , which affect the efficient frontier as a function was taken into account by this integral, which seemed to be the right way to go from their standpoints. Please let me know if this is what you are looking for, then i will try to find my notes and perhaps the paper on this, ok?