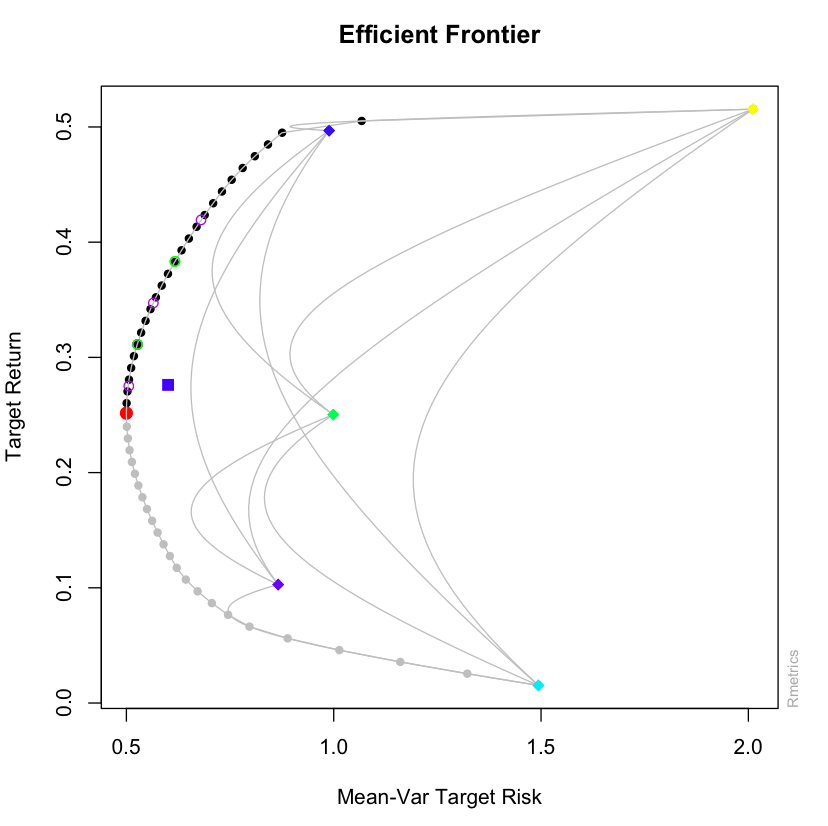
Here is an example for five stocks: The black concave is the efficient frontier as estimated in R.
I have by the power of my brain conjured two portfolios that always seem to lie on the efficient frontier. These are the green circles on the efficient frontier. I have then computed linear combinations of the two efficient portfolios marked by purple circlecircles. The interior purple circle (between the two green circles) is a positive linear combination of the two portfolios (both long 50%). The exterior purple circles are long one of the efficientgreen circle portfolios and short the other (the sum of their shares adding up to 1). All linear combinations lie on the frontier.
Regards, Dan

