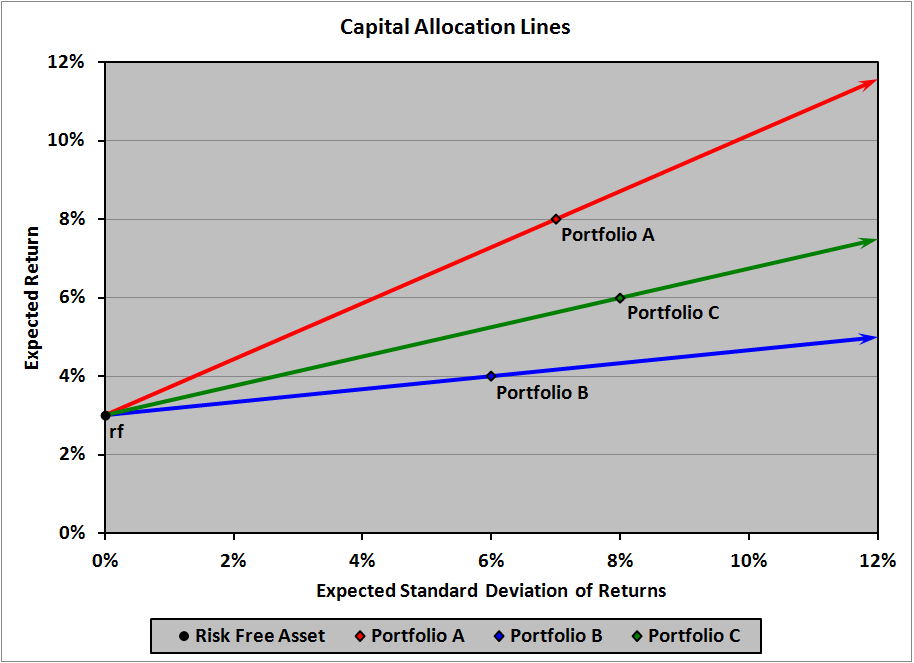
Consider the following plot, courtesy of this page:
Regarding the $y$-axis, how does this "expected return" relate to the "instantaneous expected return" in a geometric Brownian motion (GBM)?
E.g., assume each stock price follows $dS(t) = \mu S(t) dt + \sigma S(t) dW(t)$, and so $S(t) = S(0)\exp\left(\left(\mu - \frac{\sigma^2}{2}\right)t + \sigma \sqrt{t} Z\right)$ where $Z \sim \mathcal{N}(0,1)$. Then I would calculate the (annual) expected return as $$ \mathrm{E}\left[\frac{S(1)}{S(0)} - 1\right] = \mathrm{E}\left[\exp\left(\mu - \frac{\sigma^2}{2} + \sigma Z\right)\right] - 1 = \exp\left(\mu - \frac{\sigma^2}{2} + \frac{\sigma^2}{2}\right) - 1 = e^\mu - 1, $$ where the second equality is from the moment-generating function of a normal random variable.
Take Portfolio A in the plot and suppose it's just a single stock, driven by the GBM above with instantaneous rate of return $\mu$. Portfolio A has an "expected return" of $8\%$. So, which of the following (if any) do we mean?
- $e^\mu - 1 = 8\%$
- $\mu = 8\%$
