2
$\begingroup$

Dear Stack Exchange community,

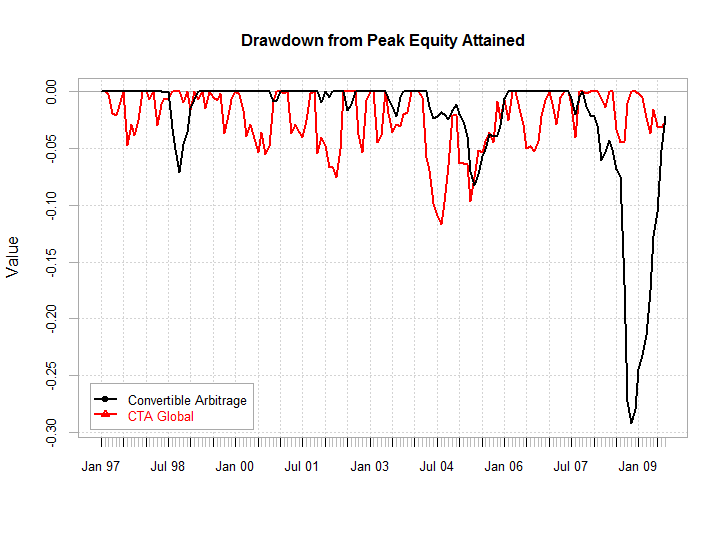
Using Performance Analytics package, chart.Drawdown, I would like to plot several drawdowns curves on the same plot to be able to visually compare them.

I know how to plot one drawdown curve using:

chart.Drawdown(R, geometric = TRUE, legend.loc = NULL, colorset = (1:12))

Is it possible to plot several curves? Can someone help me on that? Best. Joe.

$\endgroup$
2
  • $\begingroup$ A warm welcome to Quant.SE - see my answer below: quant.stackexchange.com/a/33654/12 $\endgroup$
    – vonjd
    Commented Apr 12, 2017 at 15:56
  • 1
    $\begingroup$ TY! Loving it already! $\endgroup$
    – JoeBadAss
    Commented Apr 12, 2017 at 19:57

1 Answer 1

4
$\begingroup$

No problem, just have a look at the following example from the documentation (p. 49):

data(edhec)
chart.Drawdown(edhec[ , c(1, 2)], 
     main = "Drawdown from Peak Equity Attained", 
     legend.loc = "bottomleft")

enter image description here

$\endgroup$

Your Answer

By clicking “Post Your Answer”, you agree to our terms of service and acknowledge you have read our privacy policy.

Not the answer you're looking for? Browse other questions tagged or ask your own question.