8
$\begingroup$

In Pfaff's "Financial Risk Modelling and Portfolio Optimization with R" the following stylized facts are stated (among the others, p.26):

  • The volatility of return processes is not constant with respect to time.
  • The absolute or squared returns are highly autocorrelated.

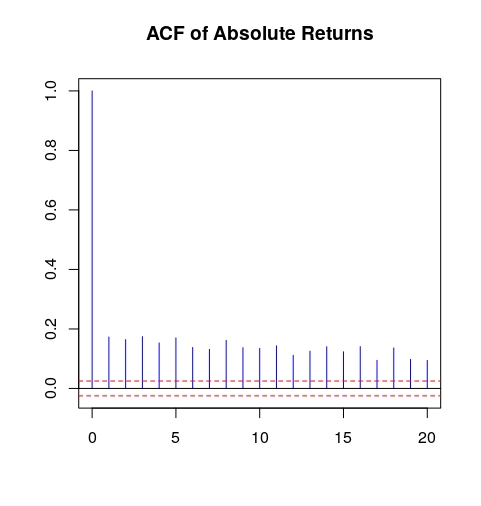
The following R code in the book is used to illustrate the latter of the above two claims:

library(fBasics)
library(evir)
data(siemens)
SieDates <- as.character(format(as.POSIXct(attr(siemens, "times")),"%Y-%m-   %d"))
SieRet <- timeSeries(siemens*100, charvec = SieDates)
colnames(SieRet) <- "SieRet"
SieRetAbs <- abs(SieRet)
acf(SieRetAbs, main = "ACF of Absolute Returns", lag.max = 20,
ylab = " ", xlab = " ", col = "blue", ci.col = "red")

It generates the picture below:

enter image description here

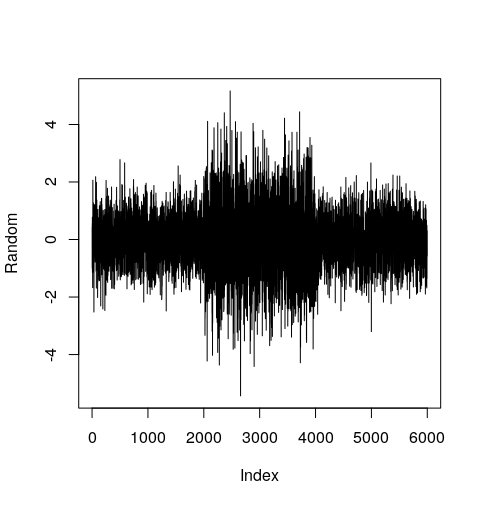
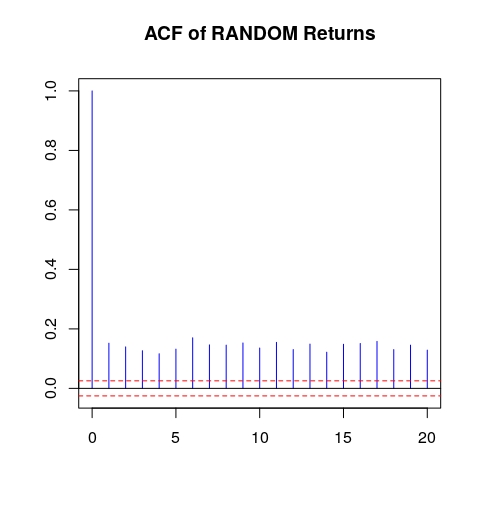
But a similar result can be achieved through introduction of single burst of volatility into the sequence of returns distributed normally with constant volatility as code below demonstrates:

Random <- do.call(c, lapply(c(0.8, 1.5, 0.8), function(x) rnorm(2000, sd=x) ) )
RandomAbs <- abs((Random))
acf(RandomAbs, main = "ACF of RANDOM Returns", lag.max = 20, ylab = " ", xlab = " ", col = "blue", ci.col = "red")

It generates the following:

enter image description here

"Random" itself is shown below: enter image description here

Can it be proven mathematically that such change in volatility will produce ACF of abs returns similar to the above? Is the opposite true?

In the Cont's article "Volatility Clustering in Financial Markets: Empirical Facts and Agent–Based Models" kindly shared with me by @JejeBelfort you may read:

A quantitative manifestation of this fact [volatility clustering] is that, while returns themselves are uncorrelated, absolute returns $|r_t|$ or their squares display a positive, significant and slowly decaying autocorrelation function: $corr(|r_t |, |r_{t+\tau} |) > 0$ for $\tau$ ranging from a few minutes to a several weeks.

But again why "Volatility clustering" implies positive autocorrelation of abs returns?

And will the returns where

large changes tend to be followed by large changes, of either sign, and small changes tend to be followed by small changes.

always produce ACF of abs returns similar to the above?

$\endgroup$
2
  • $\begingroup$ I am not familiar with R, but if your code indeed introduces a SINGLE spike, then it is unlikely that the resulting ACF will change significantly by definition. Try to add at least a couple of spikes to see a potential change. $\endgroup$ Commented Apr 26, 2017 at 10:14
  • $\begingroup$ @JejeBelfort I added picture of "Random". Spike of volatility means that volatility has been increased dramatically for some period of time and then returned to the previous level. A similar pattern can be found in "SieRet" signal $\endgroup$
    – zer0hedge
    Commented Apr 26, 2017 at 11:38

3 Answers 3

4
$\begingroup$

I think @zer0hedge has constructed a clever example by which to demonstrate what is implied by the stylized fact by which volatility begets volatility.

It is correct to conclude volatility bursts are a type of absolute autocorrelation. All volatility bursts display characteristics of autocorrelation of absolute returns, but will all types of autocorrelation of absolute returns display characteristics of volatility clustering?

I say no because this explanation leaves out other ways in which absolute returns can show signs of autocorrelation.

In order to demonstrate the stylized fact by which volatility is assumed to be stochastic (e.g., a non-stationary, mean-reverting process), we can rewrite a modified GBM as such (Heston-like model):

$\dfrac{dS_t}{S_t} = \mu \Delta t + \sigma_t \sqrt{\Delta t}*dZ_1$

$d \sigma^2_t \propto \eta \,\sigma \sqrt{\Delta t}*dZ_2$

with:

$\langle dZ_1 \, dZ_2 \rangle = \rho \, dt$

Where: $dZ_1$ and $dZ_1$ are Wiener processes; $\eta$ is the volatility of volatility; and, $\rho$ is the correlation between returns and changes in $\sigma^2_t$.

If we take the expectation with $\rho =0$, then a corresponding time-series will not be expected to produce autocorrelation of absolute returns because:

$\sigma _{Z_1+Z_2}={\sqrt {\sigma _{Z_1}^{2}+\sigma _{Z_2}^{2}+2\rho \, \sigma _{Z_1}\sigma _{Z_2}}}$

Or, the net effect of zero correlation is that expected value of two super-imposed random variables will be indistinguishable from simply raising the expectation for deterministic volatility because the sum of two normally distributed random variables is normally-distributed.

However, if the we assume that returns are trending (i.e., price momentum is accelerating/decelerating; i.e., $\mu_t$ is autocorrelated) then we should also expect to observe autocorrelation of absolute returns.

For example, say $\mu_t$ is a function of $t$, e.g.:

$d\mu_t \propto \mu_{t-\Delta t}\alpha\sqrt{t} $

where: $\alpha$ is the co-efficient of auto-correlation.

If the rate of change in returns are correlated to prior returns, then it would follow that the values of absolute returns are also correlated even in the absence of stochastic volatility and/or volatility clustering/bursts. Or, quite simply:

$\mid \frac{dS_t}{S_t} - \mathbb{E}[\frac{dS}{S}]\mid \approx \sqrt{(\frac{dS_t}{S_t}-\mathbb{E}[\frac{dS}{S}])^2}$

With so many plausible schemas that fit observations, how are any of them significantly different than astrology?

$\endgroup$
2
  • $\begingroup$ Thanks for your answer, David. Do you think you could you provide some code (R, Python or similar) in order to illustrate your conclusions? $\endgroup$
    – zer0hedge
    Commented May 1, 2017 at 7:51
  • $\begingroup$ I haven't coded in a long while, but I attempted to do something simple in a spreadsheet. The result was that the expected auto-correlation for process with a trending mean exists, but it is easily obfuscated when randomness comes into the equation. Still, when $\rho \to 1$, the auto-correlation becomes pretty strong. You can find it here: drive.google.com/open?id=0B5_EWR7GQFA1TEhReDhvYl8yUm8. $\endgroup$ Commented May 1, 2017 at 16:58
2
$\begingroup$

Such volatility pattern is a well-known stylized fact of financial time series (see Cont, Rama. Empirical properties of asset returns: stylized facts and statistical issues. (2001): 223-236 for more details) which is called volatility clustering.

Qualitatively, it means that high returns are likely to be followed by high returns, the same applying for low returns.

Quantitatively, it means that the series of absolute returns will exhibit a significant and slowly decaying pattern as in the plot you showed above.

In a nutshell, what you are looking for is actually the definition of volatility clustering, i.e. if you have such pattern, it means that there is volatility clustering.

$\endgroup$
6
  • $\begingroup$ I know about volatility clustering. My question is whether/how volatility clustering implies autocorrelation of abs returns. $\endgroup$
    – zer0hedge
    Commented Apr 26, 2017 at 12:26
  • $\begingroup$ Yes, if nearby $\sigma_t$s are correlated then observations of nearby $|r_t|$ or nearby $r_t^2$ will be correlated also. $\endgroup$
    – nbbo2
    Commented Apr 26, 2017 at 12:34
  • $\begingroup$ Have a look at the following paper from Cont: proba.jussieu.fr/pageperso/ramacont/papers/clustering.pdf On page 4 (bottom, end of section 2.1), there is a mathematical reasoning behind it, where the notion of long-range dependence is introduced $\endgroup$ Commented Apr 26, 2017 at 12:42
  • $\begingroup$ @noob2 In my example I have 2000 trading days with volatility 0.8 then 2000 trading day with almost double volatility 1.5 and then again 2000 day with 0.8. Volatilities does not correlate, but ACF of abs returns still shows autocorrelation... Isn't it meaningless to look at ACF in my case? And why it is meaningful in case of real market data? $\endgroup$
    – zer0hedge
    Commented Apr 26, 2017 at 12:47
  • $\begingroup$ @JejeBelfort Thanks. But from the first glance I coudn't find the answer to my question. It is long - 21 pages. Which paragraph should I look at? $\endgroup$
    – zer0hedge
    Commented Apr 26, 2017 at 12:57
2
$\begingroup$

Your code basically implements the assumption that you cited:

The volatility of return processes is not constant with respect to time.

Whether it's a single burst or some kind of a fancy function $\sigma_t$ is not important here. The fact is that your volatility is time varying. You may call it piece-wise constant, but it still is characterized as time varying.

The first plot demonstrates the same thing on the empirical returns, that could be sometimes modeled with stochastic volatility, which will also cause clustering and autocorrelation of squares, abs or other nonlinear function of returns.

$\endgroup$
2
  • $\begingroup$ The question is whether statistically significant autocorrelation of abs returns is mathematically equivalent to change of volatility. $\endgroup$
    – zer0hedge
    Commented Apr 30, 2017 at 18:05
  • $\begingroup$ @zer0hedge, sorry, I misunderstood your question. The abs of return is an estimator of the volatility, that's the reason why you see autocorrelation, see here $\endgroup$ Commented Apr 30, 2017 at 18:22

Your Answer

By clicking “Post Your Answer”, you agree to our terms of service and acknowledge you have read our privacy policy.

Not the answer you're looking for? Browse other questions tagged or ask your own question.