13
$\begingroup$

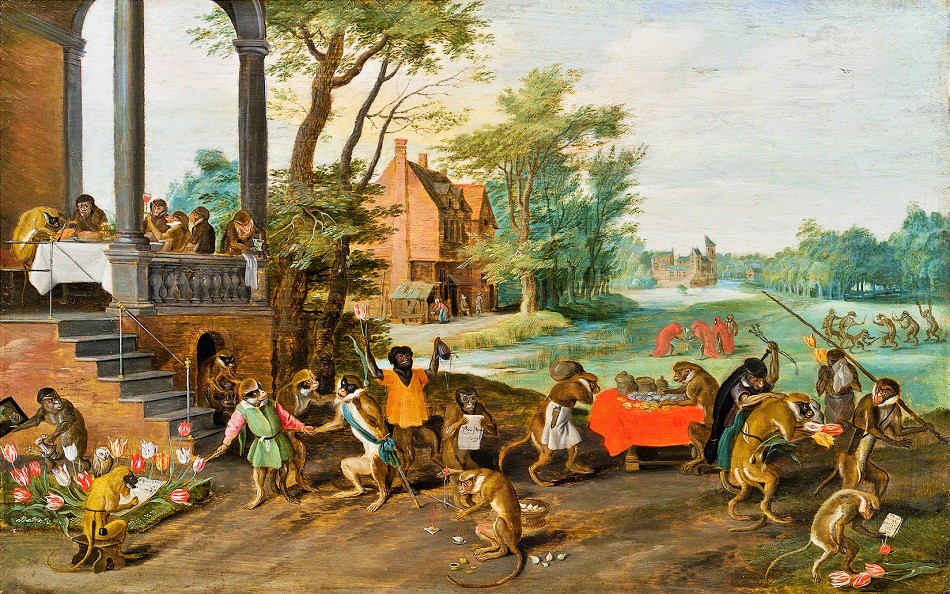
A Satire of Tulip Mania by Jan Brueghel the Younger (ca. 1640)

The Tulip mania is considered to be one of the first recorded examples of a speculative bubble in modern history. Long story short, the newly introduced tulip plant in the United Provinces, combined with the development of the first modern financial instruments like future contracts and markets to exchange future contracts, lead to a craze that suddenly burst in February 1637.

The wikipedia article has the following to say about the available data:

The lack of consistently recorded price data from the 1630s makes the extent of the tulip mania difficult to discern. The bulk of available data comes from anti-speculative pamphlets by "Gaergoedt and Warmondt" (GW) written just after the bubble. Economist Peter Garber collected data on the sales of 161 bulbs of 39 varieties between 1633 and 1637, with 53 being recorded by GW. Ninety-eight sales were recorded for the last date of the bubble, 5 February 1637, at wildly varying prices. The sales were made using several market mechanisms: futures trading at the colleges, spot sales by growers, notarized futures sales by growers, and estate sales. "To a great extent, the available price data are a blend of apples and oranges", according to Garber.[34]

It seems that the work of Garber contains the most extensive data collection. I wondered if there is a place on the net where these data are readily available, preferably in a format that is easy to parse for statistical analysis tools like R.

TL;DR : Can I download the data concerning Tulip mania somewhere?

$\endgroup$

3 Answers 3

13
$\begingroup$

I don't see anyplace obvious. My quick reading of Garber's original paper is that he greatly drew on work by Ernst Krelage which I've linked below. The Appendix I of Thompson (2007) describes in detail how he constructs his time series. I think you'll have to get your hands dirty, get into the weeds of these papers. This is probably a good thing, as the foundation for quality analysis should be some understanding of where the data comes from and what it is. You could try contacting people that are still alive.

What do these prices represent?

Perhaps of interest to this audience is the argument of Earl A. Thompson that the most extravagant prices of the Tulip mania are misinterpreted because they were strike prices for deeply out of the money call options rather than spot or futures prices! Thompson writes,

... on February 24, 1637, a large organization of Dutch florists and planters, in a decision that was later ratified by Dutch legislatures and courts, announced that all contracts written after November 30,1636 and before the re-opening of the cash market in the Spring possessed provisions that were not in the original contracts. The new provisions relieved their customers of their original unconditional contractual obligations to buy the future tulips at the specified contract price but demanded that they compensate the planters with a fixed percentage of their contract prices The provisions, in effect, converted the futures prices in the original contracts to exercise prices in options contracts.

Thompson argues that the work of the Dutch legislature essentially turned a futures contract at price $k$ into a call option with a strike price $k$ and payment of $\alpha k$ due by speculators to farmers where $\alpha$ was administratively determined to be a few percent. This predictably sent the market clearing strike price $k$ through the stratosphere.

The Economist FreeExchange blog has some coverage of the academic debate here.

McClure and Thomas (2017) question Thompson's interpretation of prices as strike prices instead of spot prices. 17th century Dutch history and law are way outside my area, I'm not a tulip expert, and I don't know which of the several sides to take.

References

Garber, Peter M., "Tulipmania", Journal of Political Economy, 97(3), 535–557., 1989

Krelage, Ernst H., Bloemenspeculatie in Neterland. Amterstdam: van Kampen, 1942

Krelage, Ernst H., Drie eeuwen bloembollenexport. The Hague: Rijksuitgeverij, 1946

McClure, JE and DC Thomas, "Explaining the timing of tulipmania’s boom and bust: historical context, sequestered capital and market signals," Financial History Review, 2017

Thompson, Earl A., "Tupilmania: Fact or artifact?" Public Choice, 2007

$\endgroup$
1
  • $\begingroup$ Thank you very much for this nice reply! Did you perform some work on this topic? Wrote a thesis or a research paper on it, maybe? $\endgroup$ Commented Nov 10, 2017 at 12:21
4
$\begingroup$

Also, check out this senior thesis on the tulip mania; the author used what sounds like the type of data you are looking for, so I would reach out to him and ask him where he got it: http://arno.uvt.nl/show.cgi?fid=129437

$\endgroup$
3
$\begingroup$

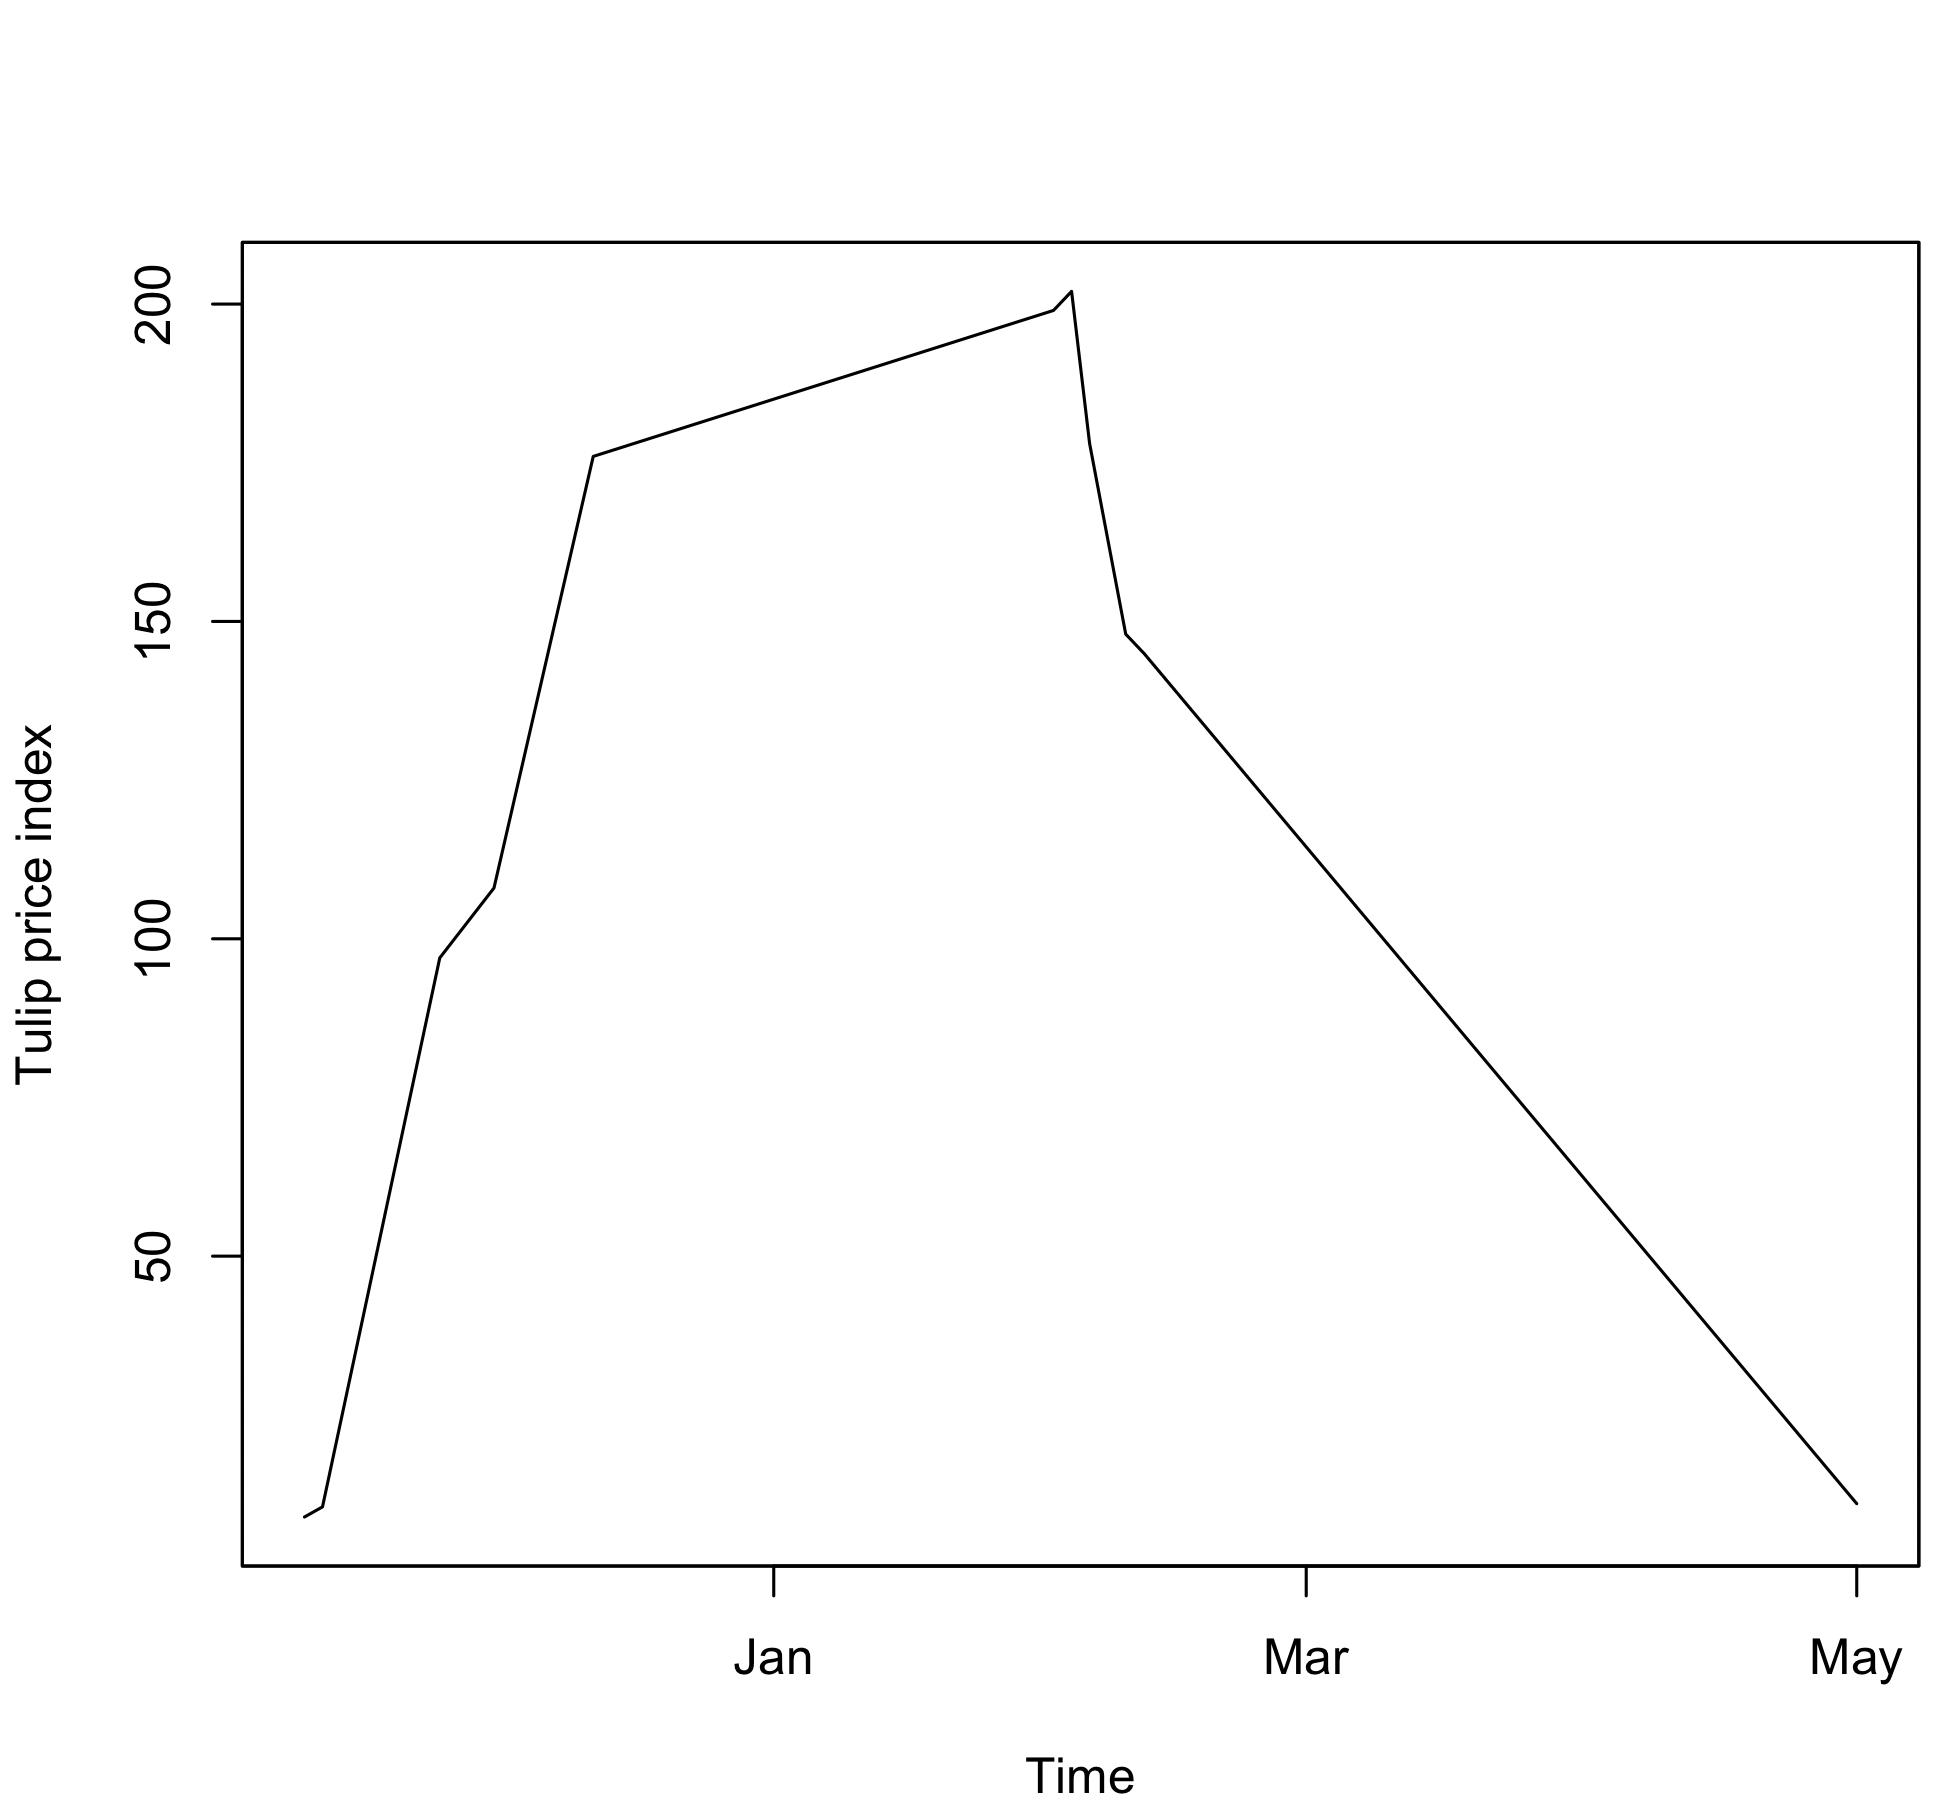
Appendix I of Thompson (2007, "The tulipmania: Fact or artifact?") mentions the following dates and respective tulip price index values. In R:

tms <- as.Date(c("1636-11-10", "1636-11-12", "1636-11-25", "1636-12-01",
                 "1636-12-12", "1637-02-01", "1637-02-03", "1637-02-05",
                 "1637-02-09", "1637-02-11", "1637-05-01"))
x <- c(8.9, 10.5, 97, 108, 176, 199, 202, 178, 148, 145, 11)
library(xts)
ts <- xts(x = x, order.by = tms)
plot(as.zoo(ts), xlab = "Time", ylab = "Tulip price index")

enter image description here

$\endgroup$

Your Answer

By clicking “Post Your Answer”, you agree to our terms of service and acknowledge you have read our privacy policy.

Not the answer you're looking for? Browse other questions tagged or ask your own question.