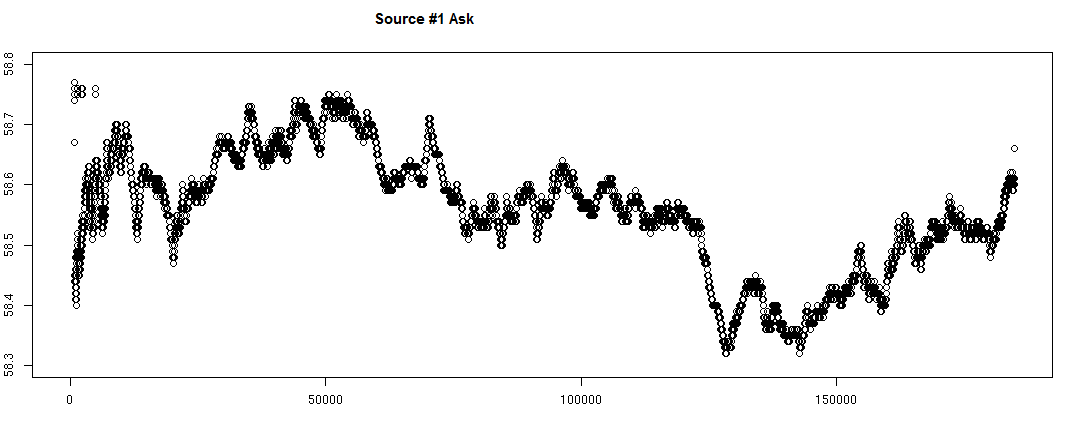
I am obtaining bid/ask price and volume market data from two different sources for the same ticker and for the same day and checking to see that at time intervals X they are "roughly the same". The timestamps from the two different sources are not exactly the same, though, and so what I am doing is dumping the price every time the timestamps span a different second of the day. Sometimes the price varies in between that second, sometimes it doesn't, but regardless I dump the way it looks at the beginning of that second (or millisecond). After doing this for both sources, I did a simple plot of the results and things are looking consistent graphically:


The time stamps do not always align, though when I intersect the time stamp columns and get a subset of the observations, and cross correlate them I get relatively poor values. Worse at higher granularities, probably due to time stamp lag-like discrepancies. I'm not sure if I should be looking at some other metric to convince myself that both sources are providing me with similar information about the ask/bid throughout the day, or what the appropiate methodology is to compare these two time series with each other. Is it cointegration between them that I am looking for? What I care to confirm is that, say, assuming the first source I know to be accurate data from which I build my view of the bid/ask throughout the day - that the second source is not too off.
