2
$\begingroup$

It is a very common idea that Fundamental analysis looks at the intrinsic value of a stock, but if I were to look at the stock market right now, I just see the movement of the price of the stock, volume, crowd behavior, and etc. I know technical analysis can use these information to find entry points and all, but I was hoping to approach it in a Fundamental analysis approach.

When I do look at financial statements, I just see the balance sheets or income statements, but that's about how much I know about how the company is performing in a financial perspective because I do not work at that company. So how do I use these financial statements (or other references) to actually say that, for example, $23.43, the current market price, is most likely below its intrinsic value, and buying it will most likely earn me profits. People will most likely financial ratios to gauge the company, but how do you use them to decide? What are all the factors or ratios that you will look at the come to a decision?

Most people will just give their thoughts and open ended answers, but if possible, a clear and basic example on the matter, until a decision whether to buy or not has been made, is preferred. Because if it's all open ended, then I feel there is a lack of understanding and I feel like it is similar to gambling


$\endgroup$
1
  • 1
    $\begingroup$ I would suggest using DCF by inverting its use: instead of estimating a fair price by plugging into the discount factors your estimated risk premium, stick to the market price and solve for the risk premium (like you do with bonds' yield to maturity). That's the output you want to match it against dividend yields and historical returns to make some research. $\endgroup$
    – Lisa Ann
    Commented May 4, 2019 at 12:01

2 Answers 2

1
$\begingroup$

You can construct some financial ratios, such as P/E Ratio or P/B.


P/E Ratio

P/E Ratio stands for Price/Earnings. As Price you can use the market value of equity and for Earnings the Total Net Profit from firm's Income Statement. Equivalently, you can divide both measures with the outstanding shares. This way P/E Ratio stands for Stock Price/EPS.

An example: Suppose that XYZ Corporation belongs in the Utility Sector. The industry P/E Ratio equals 10. XYZ has a P/E Ratio of 30. Should we buy or sell XYZ Stock?

$P/E=30$, translates to "Investors are willing to pay 30\$ for each 1$ of XYZ earnings" Stock is overvalued compared to industry's P/E Ratio, as "Investors are willing to pay 10\$ for each 1\$ of industry earnings". XYZ is a growth stock, since other companies are traded at x10 P/E Multiple, and should be sold.

Rule of Thumb: P/E Ratio is Low compared to industry (Value stock) : Buy signal
               P/E Ratio is High compared to industry (Growth stock): Sell signal

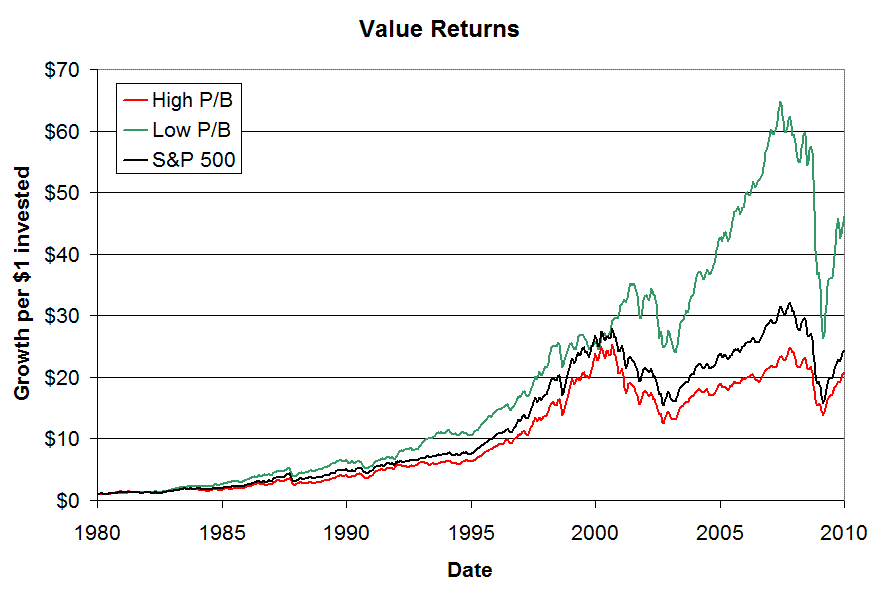
enter image description here

P/B Ratio

Stand for Price/Book Value. Market value of equity is divided by the Book value of equity(Total Shareholder's Equity, extracted from firm's balance sheet). Equivalently, you can divide both measures by the total shares outstanding. A high P/B ratio indicates expensive stock, since market value exceeds the book value. A low P/B ratio indicated a company with an "expensive" balance sheet.

Rule of Thumb: P/B Ratio is Low compared to industry: Buy signal
               P/B Ratio is High compared to industry: Sell signal

Source: http://www.stingyinvestor.com/SI/articles/MS1010b.shtml

Note that these discrimination rules refer to relationship among averages (not a deterministic rule). Also, note that these ratios are affected by accounting standards (how firm treats it's assets, revenues, expenses and so on) and informationally might be biased.

$\endgroup$
0
$\begingroup$

According to the forefront of value investing professionals and stock picker (E.g. Howard Marks) technical analysis may be used as aid to determine timing a bit better but given one can assume stock prices to develop according to a random walk, using past graphing data to determine its future development is rather unlogical, at least according to theory.

Really what you seem to be asking is how to 'fairly' value a company. Simply, there is no one true value or correct method. You would do well to review corporate finance and the valuation metrics laid out there. The most fundamental analyses to value a company are: Discounted Cash Flow methods (based on dividends, FCFF, FCFE or other cash flows. Many models have been suggested over time). Furthermore, comparable company and transaction analysis (CCA & CTA). In the industry many use CCA and CTA as an initial valuation, as its quick and dirty. DCF's are based on rigorous assumptions and can vary greatly dependent on them but a DCF is in theory the most sound valuation method.

$\endgroup$
6
  • $\begingroup$ Yes I have read books as well saying that people have tried to come up with a perfect mathematical solution using historical data and have realized that the paradigm has shifted and makes those formulas useless. However, there has to be a set of rules that should work generally--something like a checklist that will have a higher probability of success than failure. $\endgroup$
    – Pherdindy
    Commented May 4, 2019 at 9:00
  • $\begingroup$ Read 100 opinions and papers of people that claim they know and you will get methodologies that vary all over the place. As I mentioned, look into the methodology of a DCF. This is the theoretically most accurate estimation of 'intrinsic/fair' value. A phenomenal teacher in this field is A. Damodaran, professor at NYU. His insights on valuation are great. For a check list: That is something that greatly depends on your investing approach, outlook, portfolio composition etc. Some may prefer P/E (individual investors often), investment banks commonly use EV/EBITDA for more mature companies etc. $\endgroup$
    – phk31
    Commented May 4, 2019 at 9:04
  • $\begingroup$ Thanks that is a good start. I do agree with technical analysis as being used as an aid. I have been doing pure technicals to begin with, but the most important aspect at the end of the day if it is really a good company you're buying. I have bought several stocks before that are extremely oversold and have showed signs of reversals, but fundamentally, they're very bad and have bad profits so no matter how many times people tried to bottom pick, they got surprised with a surge in selling to get out of the stock. $\endgroup$
    – Pherdindy
    Commented May 4, 2019 at 9:08
  • $\begingroup$ The stock that made me the most money is a retail company that sells construction materials. I just stuck with the idea that the economy is great, lots of people are improving their homes, and that there is ongoing expansion of 100 stores over the next 3 years. The stores seem to be filled with people and useful and quality items. So I just hold the stock then no matter how many technical "guru"s indicate that it should reverse soon since it's over bought since it's IPO back in 2017, it just keeps going up because of its potential. $\endgroup$
    – Pherdindy
    Commented May 4, 2019 at 9:11
  • $\begingroup$ I'm in no place of course to advice you in how you invest and what approach you take. However, the original value investing approach put forth by Graham does not agree in any manner with pure technical analysis and looking at stocks as stocks. The underlying of stocks are of course the companies themselves and their fundamental characteristics. Valuing companies appropriately is a highly discussed and complex field with large bodies of scientific research. If it were easy, everyone would be good at it. There really is not one method that is all three: easy, accurate and quick. $\endgroup$
    – phk31
    Commented May 4, 2019 at 9:12

Your Answer

By clicking “Post Your Answer”, you agree to our terms of service and acknowledge you have read our privacy policy.

Not the answer you're looking for? Browse other questions tagged or ask your own question.