How to create charts for market data in WPF?
Are there any charting controls provided by microsoft or you need to use only third party controls?
Which are the popular third party charting controls used predominantly by banks?
I used SciChart and was happy with it. This is extremely rich charting library ($500 per licence; \$1000 with source code).
A premium UI library. I haven't tried Infragistics charts particularly, but I'm sure they are as much perfect as their other controls (grids, ribbons etc).
SciChart vs Infragistics Chart. I should add that Infragistics are mostly concentrated on the overall usability and esthetics of the charts while SciChart focuses on functionality and performance.
SciChart vs VisiBlox. The comparison between SciChart and Visiblox says that SciChart is 30%-250% faster.
Unsafe code in SciChart. SciChart uses unsafe code to write to bitmap in the fastest possible way. Once we were developing the app for Bloomberg Store we had to use WPF Toolkit instead because Bloomberg didn't allow unsafe calls.
Definitely check out SciChart, which is a commercial WPF stock chart control built with financial & scientific users in mind. There is a review posted here and here.
SciChart supports
As far as performance / speed goes, in tests it's the fastest WPF Chart!, using the same low-level bitmap rendering as you find in Windows Forms charts, and in some editions, full DirectX rendering.
It is being used in MTPredictor v7.5 (an Elliot Wave trading platform) who have tested it in live markets with several monitors and several charts all open, all ticking simultaneously. You can see a webinar of MTPredictor running SciChart here. Note MTP run a webinar once per day and videos are all on youtube.
We had a trial user contact us with a youtube demo showing scichart in real-time trading application, in a live market with multiple ticks per second being pushed to the chart.
In our installer we have several live demos showing real-time financial charting and multi-pane financial charting.
As another poster mentioned, it is a commercial chart but we aim to provide excellent support and fix bugs in a timely manner.
Hope this helps!
Full Disclosure: I am the owner and tech lead on the SciChart project
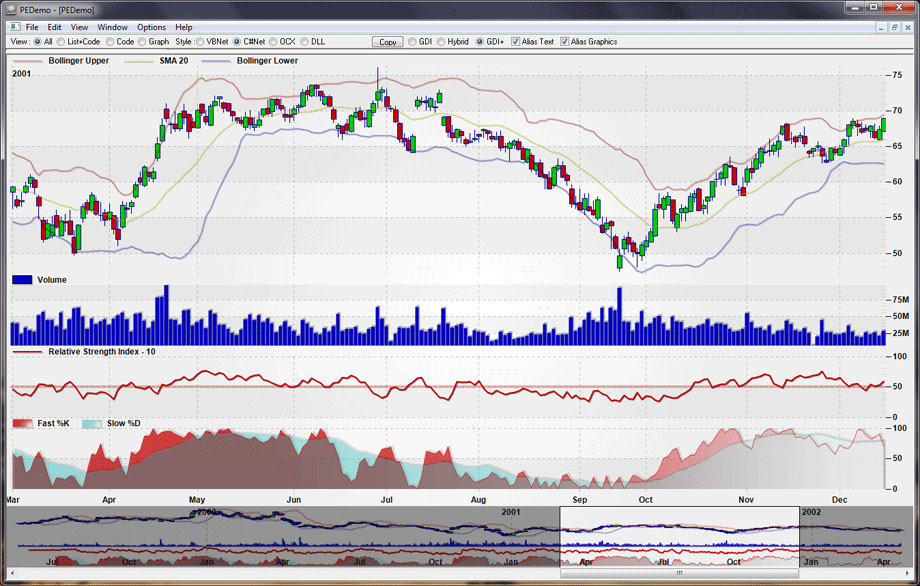
I own Gigasoft, if researching financial WPF charting, see our 7 meg demo download. Fast to download, uninstalls easily with no issues, and demonstrate our robustness, speed, user code, and rendering quality: link to financial .net wpf charting. Date time handling, mult-axes, and extensive annotations are key to good financial use and we've spent years perfecting these features.

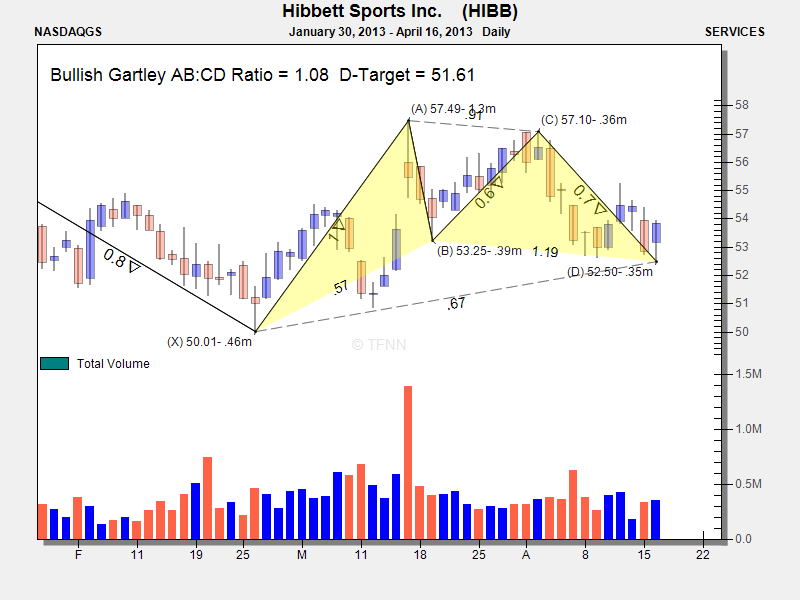
A customer was nice enough to send us this showing excellent use of annotations to produce a custom Gartley financial pattern ...

There's now a new LightningChart(R) Trader WPF library available. It is designed to provide simple and straightforward way to add charting capabilities, technical indicators and drawing tools, for WPF apps for trading and finance.
Technical Indicators
Built-in Drawing Tools
The Trader library source code (free of charge for all LightningChart subscribers) allows easy customization of this API, and adding functionality with robust and fast LightningChart WPF API, including 3D features.
Usage
I'd be happy to get your improvement suggestions for this library.
I'm tech lead of LightningChart