2
$\begingroup$

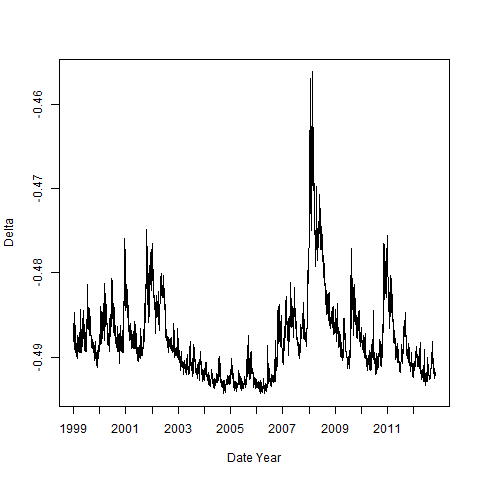
The plot below depicts the delta of a standardized at-the-money 30-day put option on the S&P500 tracker SPY over a 14-year period. This is data from OptionMetrics and standardized prices are calculated using linear interpolation from the volatility surface

My question is: Why does delta increase (i.e. decrease in absolute value) during the 2008 financial crisis?

Link: https://i.sstatic.net/0wtDm.jpg

Delta of a put option over time, whose characteristics are constant. I.e. the underlying option characteristics is modeled so that it is perpetually at the money and 30 days from expiry
enter image description here

$\endgroup$
3
  • $\begingroup$ I deleted my answer as I'm really not sure how that plot is created and if my answer correctly answers the question. I had assumed the strike equals the share price, but that likely isn't true for this chart and might be leading to the results you are seeing. $\endgroup$
    – John
    Commented Apr 11, 2014 at 15:11
  • $\begingroup$ Actually your assumption that strike equals the share price is true: the underlying option characteristics is modeled so that it is perpetually at the money. - I added some clarification in the question $\endgroup$
    – Hugstime
    Commented Apr 11, 2014 at 15:13
  • $\begingroup$ Okay, I undeleted my answer. I had to do an example to convince myself I was right again. However, there could be changes in the dividend yield that I effectively assumed away (higher dividend yields in the financial crisis should make the put delta increase away from -0.5). $\endgroup$
    – John
    Commented Apr 11, 2014 at 15:28

1 Answer 1

1
$\begingroup$

Delta increases as volatility increases.

In particular, the formula for delta of a put is $$\Delta=-exp\left(-qt\right)\Phi\left(-d_{1}\right) $$ with $$d_{1}\equiv\frac{ln\left(S/K\right)+\left(r-q+\frac{\sigma^{2}}{2}\right)t}{\sigma\sqrt{t}} $$ setting $S=K$ and $r=q$ you would get $$d_{1}\equiv\frac{\sigma}{2}\sqrt{t} $$ By the chain rule, an increase in $\sigma$ leads to an increase in $d_{1}$, which leads to a decrease in the $\Phi(-d_{1})$ term but an increase in $\Delta$.

$\endgroup$
4
  • $\begingroup$ The delta for a put option would be different, with a negative in front of d_1 and a negative infront of exp. $\endgroup$
    – Hugstime
    Commented Apr 11, 2014 at 14:35
  • $\begingroup$ Sorry, I didn't read it that carefully. Was answering for calls. I don't think it should change the answer though. $\endgroup$
    – John
    Commented Apr 11, 2014 at 14:45
  • $\begingroup$ Thanks. And would you know intuitively; why an increased volatility decreases the sensitivity of the put option price to an underlying asset's price change? $\endgroup$
    – Hugstime
    Commented Apr 11, 2014 at 14:53
  • $\begingroup$ At a mathematical level, stock prices in the Black-Scholes model are assumed to be log normally distributed. The distribution of a log normal variable is not symmetric. The mean of the log normal distribution increases as the volatility increases. This means there's a greater chance a call option will be in the money at expiration and less of a chance the put will be in the money. $\endgroup$
    – John
    Commented Apr 11, 2014 at 15:43

Your Answer

By clicking “Post Your Answer”, you agree to our terms of service and acknowledge you have read our privacy policy.

Not the answer you're looking for? Browse other questions tagged or ask your own question.