4
$\begingroup$

The trading strategies that are going to backtest well are the ones that pick the winners from the past. For example, if a trading strategy simply bought apple stock it would backtest extremely well. The bias is easy to spot in this specific scenario, but for complex trading strategies there could be hidden bias of this type.

I am wondering if it is possible to eliminate this bias by backtesting in a different manner. What if you used the historical data to build a statistical model of the market or part of it. Such a model could include the risk free rate, historic volatilities, and correlations between stocks, etc. You could then run a monte Carlo simulation where you backtest against multiple, statistically generated historical data. You could use this to develop statistics about how the strategy works in a broader sense.

Any thoughts on this idea?

-- Reference : https://www.quantopian.com/posts/backtesting-thoughts

$\endgroup$

4 Answers 4

3
$\begingroup$

Have you checked White's "reality test" (White H. A reality check for data snooping. // Econometrica. 2000. № 68. С. 1097–1126.)?

Anyway, when you use Monte-Carlo, you always have a variation of "double hypothesis" issue, noted by Fama: first hypothesis is that your model of the market is right, and the second - that trading rule you test (against your market model) actually adds value. Positive answer to the second question makes sense only when the answer to the first is strict 'yes'. And is the first question falsifiable? Perhaps, no.

So, your results might be interesting to publish, but dangerous to trade, in my opinion.

$\endgroup$
2
0
$\begingroup$

Backtesting, to me, necessarily involves testing against (realised) history of the securities under question. Wikipedia also seems to support this interpretation. http://en.wikipedia.org/wiki/Backtesting

This history of the realised prices, of the securities under question, was generated by a certain pricing "model" or distribution. If you test against a different hypothetical set of prices for the securities then its not backtesting. You are testing against a realisation of prices which might or might not occur in the future.

So my answer to your specific question is that pure backtesting (as opposed to in-sample, out-of-sample) methods might not ever completely guard against data snooping bias.

$\endgroup$
0
$\begingroup$

According to me, backtesting resumes to a validation process of the optimization method employed to fix parameters of your model.

In such case you can perform multiple out of sample backtests, each of one having a different out of sample-period devoted to the optimization of the parameters and a second period to test the strategy.For each testing period you input new (optimized) parameters in your trading strategy. Then by observing results you can see if your optimization (and your model) is stable and correct over a long horizon. Additionally, in doing so, your backtests are never based on "in sample" data and you eliminate the bias. It allows you to evaluate the stability of the optimization method and not of a particular scenario.

This methodology is called Walk forward optimization, you can read the following book to know more about it :

The Evaluation and Optimization of Trading Strategies, 2nd Edition by Robert Pardo ISBN: 978-0-470-12801-5 Wiley trading.

For a quick overview : Wiki link.

Ps : I will not use simulated data based on another statistical model because it will add another uncertainty in the evaluation (i.e : is your statistical model correct ?)

$\endgroup$
-1
$\begingroup$

Simulated Historical Data?

YES!

I use this definition to simulate historical closing price data so that I can

backtest against multiple, statistically generated historical data

in python:

def sim_data():

    for n in range(10): # datasets to generate
        sine = 'sine_' + str(n)
        log_periodic = 'log_periodic' + str(n)

        v = 7           # number of harmonics
        w = 0.0000004   # base acceleration
        x = 0.0000032   # cyclic acceleration
        z = 0.08        # random walk amplitude
        y = 0.0023      # frequency

        storage[sine] = 1 + x - w
        for a in range(1,v):
            storage[sine] += (x/a)*math.sin(y*a*info.tick)
        storage[log_periodic] = storage.get(log_periodic, 
            float(data.btc_usd.price)) #begin at same price as first tick
        storage[log_periodic] *= math.pow(storage[sine], info.tick)
        storage[log_periodic] = ((1-z)+2*z*random.random()
            )*storage[log_periodic]   

        plot(('log_periodic'+str(n)), storage[log_periodic], secondary=True)  

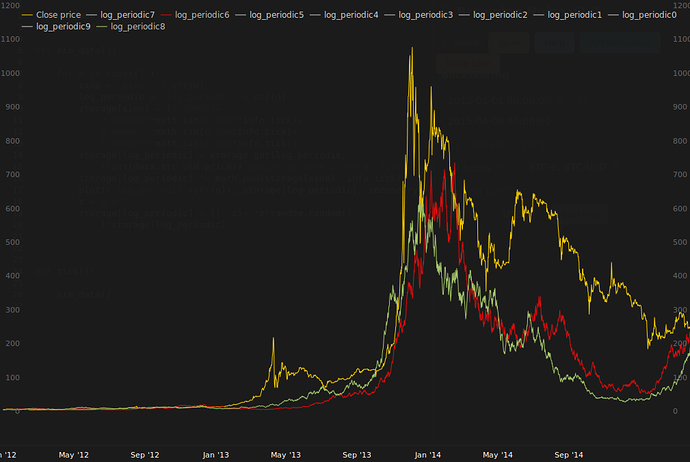
https://tradewave-discourse-uploads.s3.amazonaws.com/1592154d07d578f4fa75231a0e1b47464bd30ba713b8_690x462.png

The yellow line is the price of bitcoin.

The other lines are simulated completely independently of closing price.

You can adjust the parameters to change the nature of the growth/decay

        v = 7           # number of harmonics
        w = 0.0000004   # base acceleration
        x = 0.0000032   # cyclic acceleration
        z = 0.08        # random walk amplitude
        y = 0.0023      # frequency

I call this:

Log Harmonic Random Walk

I'm developing this definition here: https://discuss.tradewave.net/t/simulated-hlocv-for-overfit-testing/497/16

$\endgroup$

Your Answer

By clicking “Post Your Answer”, you agree to our terms of service and acknowledge you have read our privacy policy.

Not the answer you're looking for? Browse other questions tagged or ask your own question.