2
$\begingroup$

For my research I need to obtain a series of densities, however, I am encountering some problems.

The first problem is perhaps very simple, but the answer eludes me. Let's say I have an observation from a time series, $x=0.001$ together with estimated mean $\mu=0.0001$ and standard deviation $\sigma=0.4$. Using R:

dnorm(0.001, 0.0001, 0.4)
z=(0.001-0.0001)/0.4
dnorm(z, 0, 1)

where z is the standardized variable. Why are the result different?

The second issue is connected to Hansen's Skew-t distribution. Let's add the skew $\lambda=0.1$ and shape $\eta=5$ parameters. When plugging in the all the parameters into the pdf (I take z which takes $\mu$ and $\sigma$ into account) I obtain $0.4832$, but when I use the sgt package in R:

dsgt(0.001, 0.0001, 0.4, 0.1, p = 2, 5, mean.cent=TRUE, var.adj=TRUE)

Iobtain $1.075749$. Inputting the standardized variable z and $\mu = 0$ and $\sigma = 1$ into the above yields $0.5425881$.

Can you please explain the reason why the values are different?

$\endgroup$

2 Answers 2

3
$\begingroup$

You know that :

$X \sim N(\mu,\sigma^2)$.

$Z = \large\frac{X-\mu}{\sigma}$.

$\text{Var}(Z) = \large\frac{1}{\sigma^2}\text{Var}(X) = \large\frac{1}{\sigma^2}\sigma^2 = 1$.

So that $Z \sim N(0,1)$.

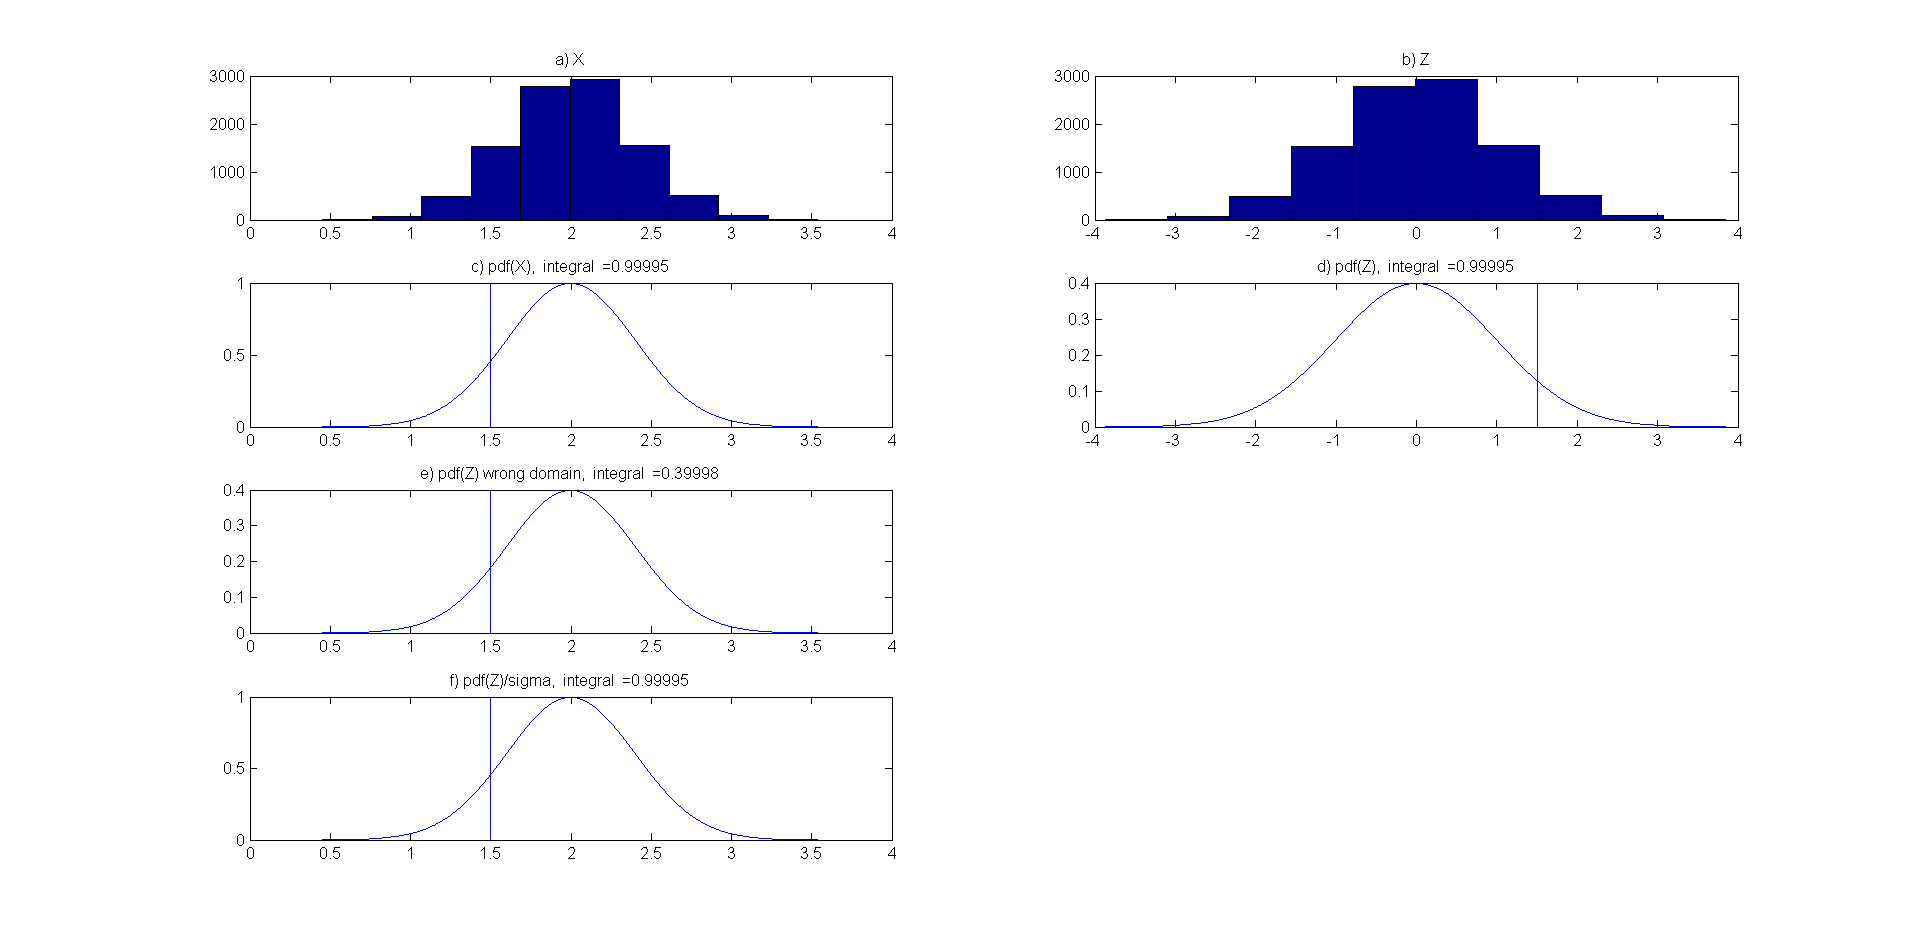
However note that the pdf evaluated for X and Z have different domains.

The following figure illustrate it :

enter image description here

  1. $X$ is plotted in a) and $Z$ in b)
  2. Their respective normal pdf are plotted in c) and d). Note that their integrals equals 1.
  3. In e) I applied the pdf of Z on the (wrong) original domain , notice that the integral is different of 1.
  4. To obtain the correct pdf on the original domain we need to scale the pdf(Z) by ($1/ \sigma$), this is done in f). The integral is ok and equal to 1.

The vertical line is evaluated at X= 1.5, you see that the density differs accordingly the domain.

So in your example you also need to scale the density by ($1/\sigma$) :

(1/sigma)*dnorm(z, 0, 1) = dnorm(0.001, 0.0001, 0.4)

To summarize when you use a normal transformation you need to scale the density by ($1/ \sigma$) to get the correct density in the original domain.

You can find the matlab code used in this answer here.

I think you second issue and some of your others questions are related to this problem.

$\endgroup$
1
$\begingroup$

Have a look at ?dnorm, and rather use the standardized value as argument in your function, in addition to mean and sd:

a_<-dnorm((0.001-0.0001)/0.4, mean=0, sd=1)

Hope it helps

[EDIT] Likewise from ?dsgt

st<-(0.001-0.0001)/0.4

skewt<-dsgt(st, mu=0, sigma=1, lambda=0.1, p = 2, q=5, mean.cent=TRUE, var.adj=TRUE)

results in skewt=0.4302996 (close to your value)

For an explanation of the differences between Hansen(1994) and the recent references used in dsgt maybe it's worth posting a thread to Cross Validated (see link for related discussions)

Hope it helps

$\endgroup$

Your Answer

By clicking “Post Your Answer”, you agree to our terms of service and acknowledge you have read our privacy policy.

Not the answer you're looking for? Browse other questions tagged or ask your own question.