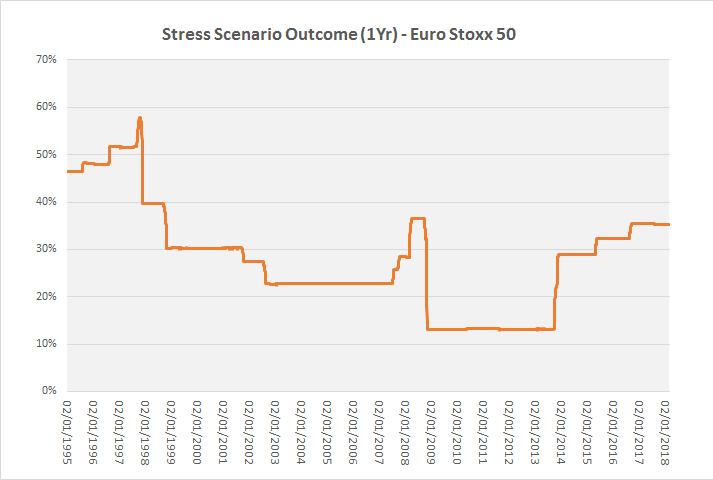
Having calculated the 1Y stress scenario at certain dates on the Euro stoxx 50 series, I realise that it jumps during June 2017. As at 31/5/2017 I get 0.347660613, and as at 30/06/2017 I get 0.663384825.
Am I right in saying that the KID would show at the end of May that there is a stress risk of losing 65.23% over one year, while the KID at the end of June would show a stress risk of losing 33,66% over one year ?
Firstly, can someone indicate if my calculation is terribly wrong ?
Secondly, would financial advisors, clients, regulators be aware of the limitations of showing these scenario statistics at one single date, and without some interpretation ?
Regards.

