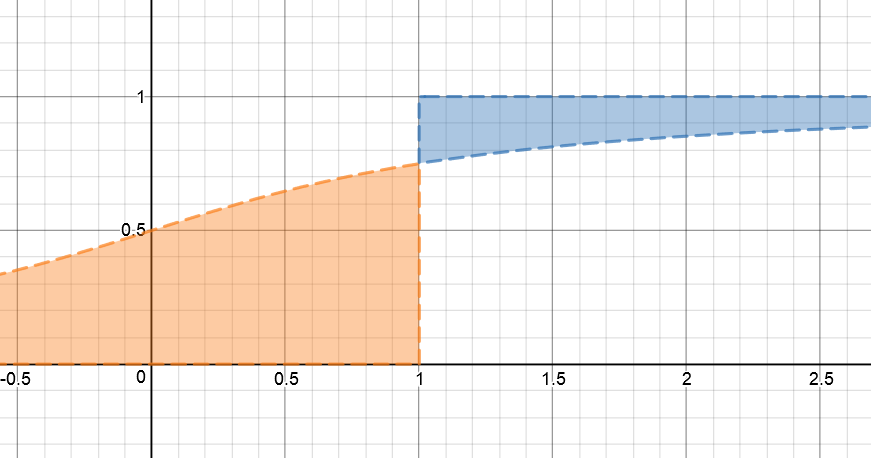
That picture in the other answer is pretty slick (+1), so I will just add a note on why one can interpret the colors of those areas like that:
- Blue:
Define $Y = (X-x)_+$. This is nonnegative r.v., so you can take advantage of the formula
$$
\mathbb{E}[Y] = \int_0^\infty [1-F_Y(y)] dy \tag{1}.
$$
where $F_Y$ is the cdf of $Y$. The image plots $F_X(x)$, the cdf of $X$, though. For any $y \ge 0$
\begin{align*}
F_Y(y)
&= \mathbb{P}[Y \le y] \\
&= \mathbb{P}[(X-x)_+ \le y] \\
&= \mathbb{P}[(X-x)_+ \le y, \{X > x \}] + \mathbb{P}[(X-x)_+ \le y, \{X \le x \}] \\
&= F_X(y+x)
\end{align*}
Using a change of variables $t = y + x$, we get
$$
\mathbb{E}[(X-x)_+] = \int_0^\infty [1-F_X(y+x)] dy = \int_x^\infty [1-F_X(t)] dt.
$$
The last expression $\int_x^\infty [1-F_X(t)] dt$ is exactly the area of the blue region.
- Orange:
Define $W = (X-x)_-$. This is also nonnegative, and we can take advantage of (1) again. The only additional bit is the identity mentioned by @raskolnikov: $(X-x)_-=(x-X)_+$.
Let $w \ge 0$; then
\begin{align*}
F_W(w)
&= \mathbb{P}[W \le w] \\
&= \mathbb{P}[(X-x)_- \le w] \\
&= \mathbb{P}[(x-X)_+ \le w, \{X > x \}] + \mathbb{P}[(x-X)_+ \le w, \{X \le x \}] \\
&= \mathbb{P}[X > x ] + \mathbb{P}[x - w \le X \le x] \\
&= 1- F_X(x-w)
\end{align*}
After a change of variables you get the formula for the orange region:
$$
\mathbb{E}[(X-x)_-] = \int_{-\infty}^x F_X(t)dt.
$$


