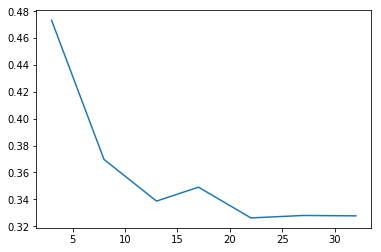
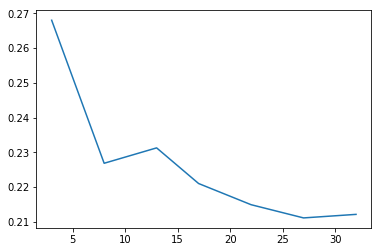
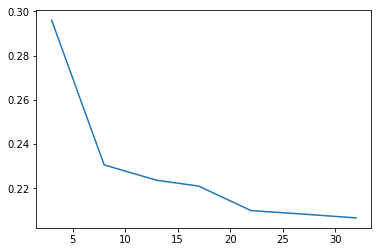
It's an empirical fact that the implied volatility of short term weekly options are significantly higher than options that expire in a few weeks, and the volatility of the near term options get even higher as we approach expiration. I've included some images of the ATM implied volatility of some option chains against days to expiration. What's the best way to model this behavior?
$\begingroup$
$\endgroup$
5
-
$\begingroup$ What is the underlying? $\endgroup$– AlRacoonCommented Jan 29, 2019 at 19:14
-
$\begingroup$ All equities - HOG, PFE, MMM. I just included those as an example. A similar structure exists for virtually all stock and index options. $\endgroup$– user3294195Commented Jan 29, 2019 at 19:17
-
$\begingroup$ I haven’t seen that in Europe. Are you maybe missing some jump event that manifests in a higher B/S volatility when not priced - e.g. earnings announcements? $\endgroup$– LocalVolatilityCommented Jan 29, 2019 at 20:43
-
$\begingroup$ All these equities had earnings recently so there's no longer any event being priced in. Even ETF options like SPY, IWM and QQQ have a similar term structure. $\endgroup$– user3294195Commented Jan 29, 2019 at 21:06
-
$\begingroup$ Are you looking for a way to model this behaviour or to explain it ? $\endgroup$– Antoine ConzeCommented Feb 1, 2019 at 10:41
Add a comment
|


