2
$\begingroup$

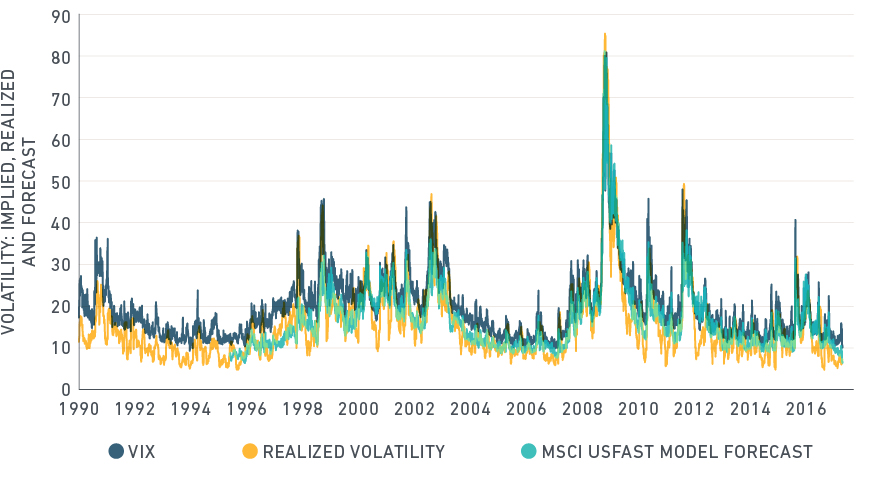
The VRP is usually displayed by charts like this one:

enter image description here

It's easy to see that, for most of the time, options are priced by using volatility which will reveal itself larger than the realized one. So VRP is simply the arithmetic difference between implied (or model-free) volatility and realized volatility.

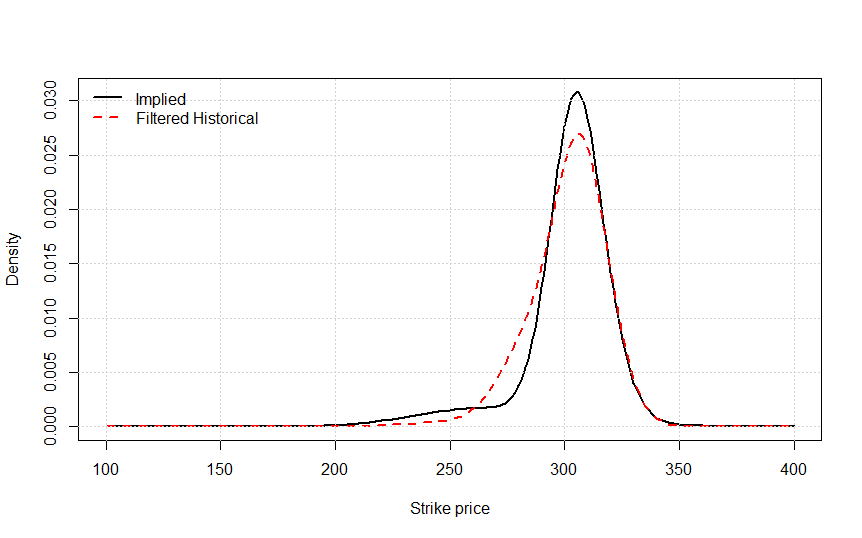
However, I'm wondering what's the best way to measure and quantify VRP when we have density functions instead of volatility measures. In the following case, for example, we have two arrays with probability densities and an array with strike prices:

enter image description here

How would you quantify the VRP?

$\endgroup$
1
  • 1
    $\begingroup$ I would determine the Q and P price for European options on the underlying. Afterwards I'd just use the VIX formula to get an P and Q price for the variance. $\endgroup$
    – Phun
    Commented Jul 30, 2019 at 16:11

1 Answer 1

3
+50
$\begingroup$

First, VRP is (loosely speaking) the difference between the implied and objective variance of future returns:

$VRP_t = Var_t^P[R_{t+1}] - Var_t^Q[R_{t+1}]$,

of which only the second, risk-neutral variance is observed at time $t$. Assuming that (1) investors have been correct on average about the future variance, and that (2) the premium is stationary, one can quantify the magnitude of VRP by taking the difference of these historical averages you are talking about.

With that said, the way to do the same with the densities is to:

  • have an implied and historical density for each time period in your sample;
  • convert the domain of each to returns using the spot price at that date;
  • calculate the variances as the integral over the domain;
  • average the differences.
$\endgroup$
4
  • $\begingroup$ What do you think about Phun's solution of using VIX formula on $\mathbb Q$ and $\mathbb P$ option prices instead of using the integral? (Of course, $\mathbb Q$ prices come from the market, while $\mathbb P$ prices are built by using the filtered historical density). $\endgroup$
    – Lisa Ann
    Commented Jul 31, 2019 at 10:18
  • $\begingroup$ @LisaAnn no idea what a Q and P price is. There is only one price. $\endgroup$ Commented Jul 31, 2019 at 11:45
  • $\begingroup$ When you write «average the differences» you mean over the time series, correct? So, if I have only the last observation of both densities, there's no average involved, just the integral. Another question: if the densities were log-normal mixtures with known parameters, could I use the weighted sum of the variances to get the VRP? $\endgroup$
    – Lisa Ann
    Commented Jul 31, 2019 at 12:43
  • 1
    $\begingroup$ >> you mean over the time series... exactly >> could I use the weighted sum... not really, see stats.stackexchange.com/a/16609/205713 $\endgroup$ Commented Jul 31, 2019 at 14:35

Your Answer

By clicking “Post Your Answer”, you agree to our terms of service and acknowledge you have read our privacy policy.

Not the answer you're looking for? Browse other questions tagged or ask your own question.