1
$\begingroup$

I am not sure if this question is appropriate here, but I am just going to give a shot. It is related to an empirical observation about the price of a call option. Specifically, I was looking at a very out-of-the-money call on AMZN, namely AMZN Jan 15 '21 $3000 call. I noticed that it follows the price of the stock (AMZN) very closely.

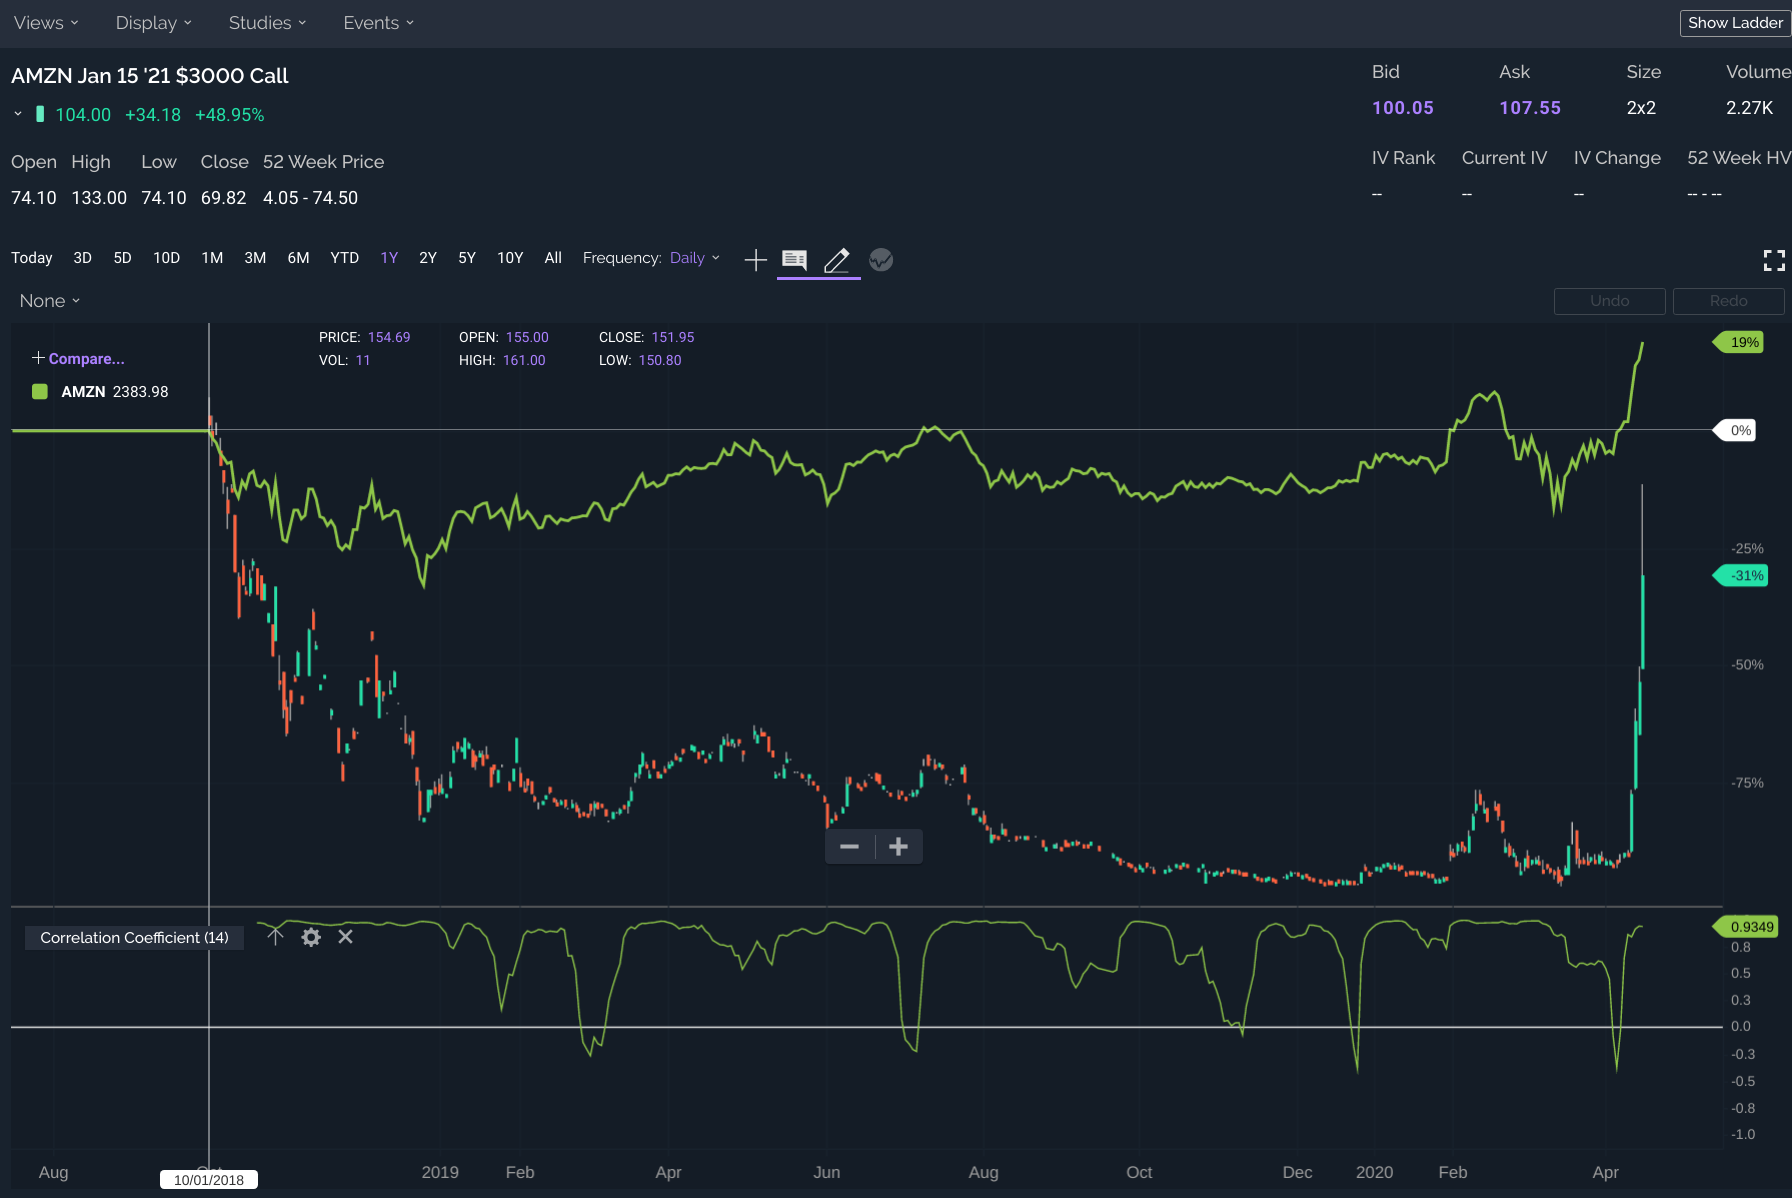
I then plotted the correlation coefficient between the price of the call option and the price of the underlying stock and here is the result (according to trading platform I am using):

enter image description here

According to this plot, the correlation coefficient between these two fluctuates, but often it is very high, i.e. $\ge 0.9$. Current stock price (at close) is about \$2408 and option price is roughly \$104 (taking the midpoint between bid and ask). Again according the trading platform, the $\delta$ for this option is $0.286 \approx 0.3$ (with an IV of 33.6%). Assuming they are using the Black-Scholes model to price the option and they are doing the calculation correctly, it seems that there is a big mismatch between the model and the actual data (i.e., between 0.3 and 0.9)?

Is there an explanation for this? Am I missing something? I am not an expert in quantitative finance, but do people in the field care about these discrepancies between theory and empirical evidence? Are there any good papers on it to explore more?

$\endgroup$

2 Answers 2

5
$\begingroup$

Correlation of 1 means the option price moves in the same direction of the underlying with perfect association, it says nothing about how much the option price moves. In general, correlation coefficients measure the strength and direction of a linear statistical relationship, not the magnitude of that relationship

In your example, a correlation coefficient of .9 implies a strong, positive linear relationship between the price of the AMZN call and the price of AMZN equity. Delta quantifies the magnitude of that linear relationship. A Delta of .3 implies that the price of the AMZN call will rise by 30% relative to the rise in price of AMZN equity.

Correlation = Strength and direction of linear relationship

Delta = Option price sensitivity (in dollar terms) of that linear relationship

$\endgroup$
1
  • $\begingroup$ Thanks. Based on your answer, I realized my mistake. I will add an answer explaining it. In statistical terms, delta would be more related to the covariance between the two rather than correlation. Thanks for the references. $\endgroup$
    – passerby51
    Commented Apr 17, 2020 at 5:58
1
$\begingroup$

Based on the answers given, I realized my mistake (which is a bit embarrassing in the hindsight.) So here is roughly what is going on form a statistician's perspective:

Let us say the price of the call option and the stock are $C_t$ and $S_t$ and the relation is $C_t = f(S_t;t)$. Let us say that the interval we consider is small enough that the dependence of $f(\cdot,t)$ on $t$ can be ignored, i.e., we assume $C_t = f(S_t)$. By a first-order Taylor expansion around $S_{t_0}$ (again rough approx.), we would have $$ C_t \approx C_{t_0} + \delta (S_t - S_{t_0}) $$ where $\delta = f'(S_{t_0}) = \partial f / \partial S\mid_{S=S_{t_0}}$. Letting $\alpha= C_{t_0} - \delta S_{t_0}$, we can model the price as $$ C_t = \alpha + \delta S_t + \epsilon_t $$ in a small interval around $t_0$. Fitting the regression by least squares will give $$\hat \delta = \frac{\rho_{CS}}{\rho_{SS}}$$ where $\rho_{CS} = \frac1{|I|} \sum_{t \in I} (C_t - \bar C)(S_t - \bar S)$ is the empirical covariance between $C_t$ and $S_t$ and $\rho_{SS} = \frac1{|I|} \sum_{t \in I} (S_t - \bar S)^2$ is the empirical variance of $S_t$. On the other hand the (empirical) correlation coefficient between the two would be $$ \hat r = \frac{\rho_{CS}}{\sqrt{\rho_{CC} \rho_{SS}}}. $$ The correlation coefficient would be the sensitivity of the normalized price of the call option to the normalized price of the stock when both are standardized by their standard deviations.

$\endgroup$
0

Your Answer

By clicking “Post Your Answer”, you agree to our terms of service and acknowledge you have read our privacy policy.

Not the answer you're looking for? Browse other questions tagged or ask your own question.