3
$\begingroup$

I'm a DIY investor that attempts to put together his market portfolio, tilted to increase factor exposure. Currently, I'm trying to do it based on the French-Fama 5-factor model.

This model contains so-called "profitability" factor, that is based on the evidence that stocks of companies with high profitability on average lead to higher future stock return.

Assuming the market is efficient, such companies have should have some additional risk associated with them(or other issues that affect the preference of investors).

The question is, in what way are they risky? On face value, companies with high profitability seem to be reliable and successful, which should mean lesser risk and lesser premium.

$\endgroup$
5
  • 1
    $\begingroup$ Yes, the "additional risk" explanation is becoming hard to believe at this point. Some sort of Behavioral Finance explanation or market inefficiency seems more likely to me. But this a controversial issue and my opinion does not count very much. The finance professors have not yet made up their mind about what is going on... $\endgroup$
    – nbbo2
    Commented Jun 20, 2020 at 21:10
  • $\begingroup$ In such a case wouldn't it be an easy arbitrage opportunity? It's well-documented for a long time but the premium does not seem to disappear. $\endgroup$ Commented Jun 21, 2020 at 8:42
  • $\begingroup$ @NikolayRys It would only be an arbitrage if the profitability premium didn't carry any risk. It is possible that profitable (small/value/recent winner) stocks are just more risky than unprofitable (big/growth/recent loser) stocks. Then, there's no reason why the premium should vanish. Think of it this way: the equity premium is well-studied but doesn't vanish. Why should it? Stocks are riskier than bonds. The same can apply to cross-sectional anomalies. $\endgroup$
    – Kevin
    Commented Jun 21, 2020 at 16:23
  • $\begingroup$ > profitable (small/value/recent winner) stocks are just more risky than unprofitable > Then, there's no reason why the premium should vanish. My understanding is that this riskiness should be already priced in a stock and it could be diversified away. Thinking of it, probably I should reword my question to "Why profitability risk is not treated as an unpriced and idiosyncratic". $\endgroup$ Commented Jun 21, 2020 at 16:32
  • 1
    $\begingroup$ It would be idiosyncratic and diversifiable risk if the CAPM or the three-factor model from Fama and French (1993) were true. But because this premium (puzzle) exists, Fama and French (2015) and Hou et al. (2015) included some form of profitability in their specification of a (reduced-form) SDF. In this sense, profitability is another dimension to systematic risk, just like value or size and cannot be diversified. $\endgroup$
    – Kevin
    Commented Jun 21, 2020 at 17:13

3 Answers 3

5
$\begingroup$

As @skoestlmeier and @noob2 commented there's much research going on about the profitability anomaly.

Firstly, there are different ways of measuring profitability. Novy-Marx (2013, JFE) uses gross profitability, Fama and French (2015, JFE) total profitability and Hou et al. (2015, RFS) return on equity. The $q$-theory model from Hou et al. claims to explain momentum with its profitability factor.

So, what could be a risk-based explanation for profitability? Different explanations have been proposed. I present two arguments here using real options asset pricing. In that stream of the literature an idealised firm uses production and investment decisions (``real options'') optimally as to maximise its value. The riskiness of these options then equates to the firm's systematic risk. This way, you obtain a neoclassical, risk-based explanation for many cross-sectional anomalies. For example, there exist models which can explain, amongst others, momentum, size, value, investment and profitability effects.

I present results from two papers here.

  • Bali, del Viva, Lambertides, and Trigeorgis (2019, JFQA)

The authors argue that profitable stocks are mostly invested in cash-generating assets-in-place and own only few growth options. Zhang (2005, JF) explains how assets-in-place are riskier than growth options to rationalise the value premium: assets-in-place have high adjustment costs and a countercyclical price of risk. In plain English, growth options are much more flexible and thus less risky. As a result, the larger the proportion of assets-in-place compared to the proportion of growth options, the risker the firm.

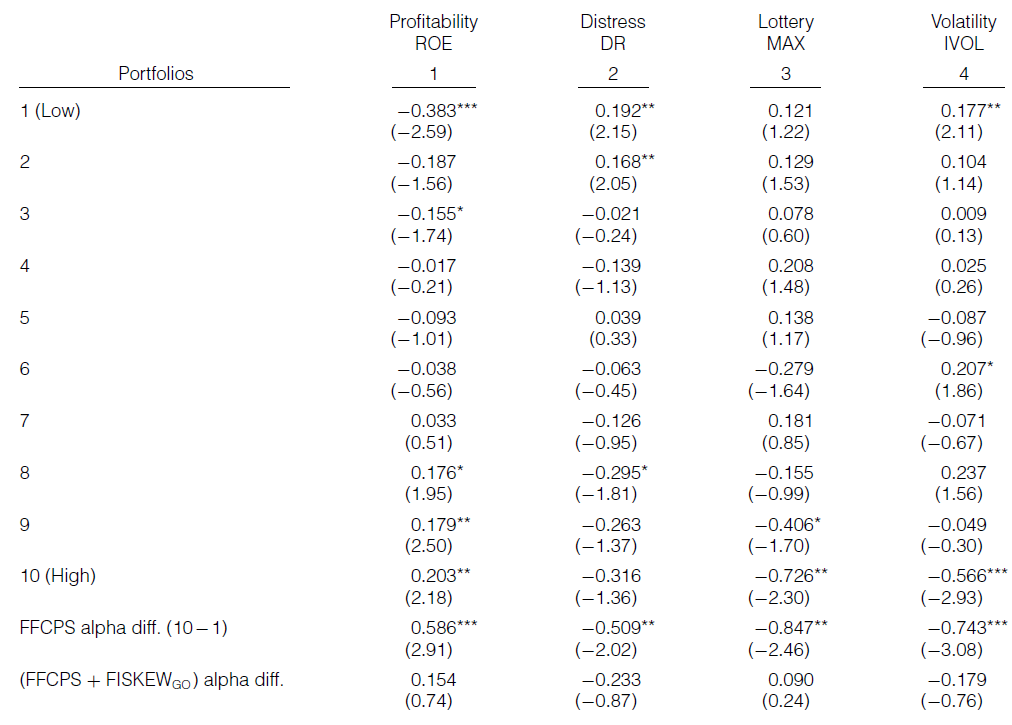
Bali et al. further argue that growth options induce more skewness to the returns of the firm because the payoff of (growth) options is convex. They then estimate expected growth option induced idiosyncratic skewness and construct a factor based on this variable. Here's a part of Table 4 from their paper:
enter image description here

As you see in column 1, the higher profitability (measured as return on equity), the higher returns and indeed, the spread portfolio has a significant return after adjusting for risk from market, size, value, momentum and liquidity. However, in the last row, when including the future idiosyncratic by growth options induced skewness factor (FISKEW$_\mathrm{GO}$), the alpha vanishes and is statistically indistinguishable from zero. As it happens, the same is true for three further anomalies based on distress, lottery and idiosyncratic volatility.

  • Aretz and Pope (2018, JF)

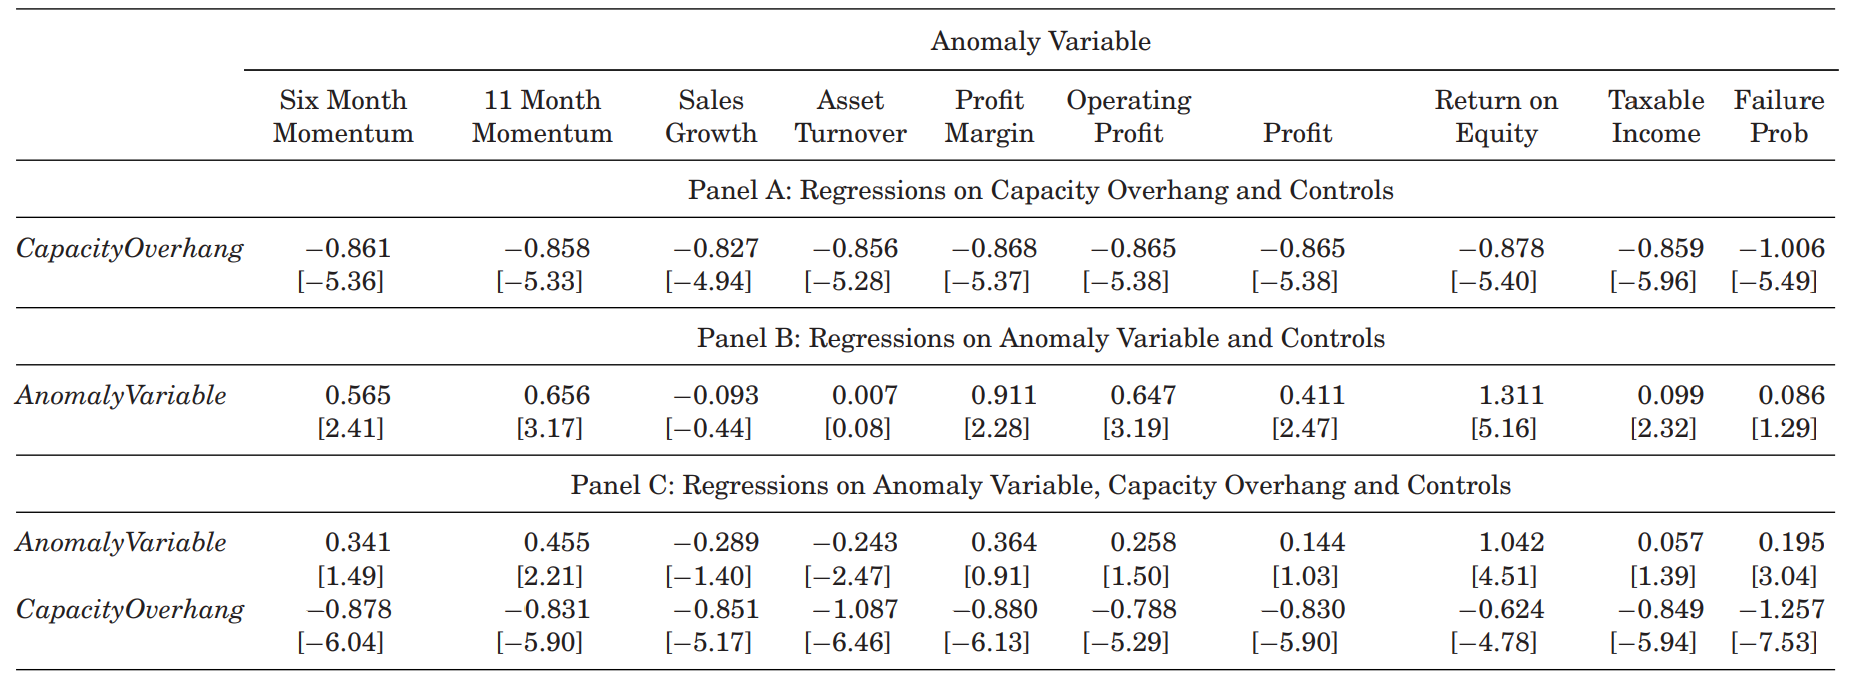
Unlike Bali et al., Aretz and Pope provide a theoretical, partial equilibrium model which features a variable called ``capacity overhang'', which is the difference between installed capacity and optimal capacity (optimal capacity being the capacity maximising the net firm value). Using a stochastic frontier model, the authors estimate firm-wise capacity overhang every month and find that it, unsurprisingly, relates negatively to stock returns. Furthermore, the variable helps explaining momentum and profitability but not value or investment. Here's a part of Table 7 from their paper.
enter image description here

You can see the results of Fama-MacBeth (1973) regressions (all regressions presented here include unreported constants and controls). Panel A confirms that capacity overhang relates negatively to stock returns. Panel B confirms that the anomalous behaviour of various momentum and profitability variables. Most importantly, Panel C demonstrates that capacity overhang helps explaining momentum and profitability. Look at columns ''Operating Profit'' and ''Profit''. Both variables have a positive and statistically significant impact on returns (Panel B) but are rendered insignificant when including capacity overhang.

As you see, here are two recent papers which provide empirical evidence how profitability effects can emerge from a neoclassical setting in which rational firms maximise their value. This is fully in line with efficient markets. Of course, there are other potential explanations, including behavioural arguments. The jury is still out on which approach is the correct one.

$\endgroup$
2
$\begingroup$

In addition to @KeSchn excellent answer i will provide the original intent by Fama/French as they proposed the "Profitability" factor in their 2015 paper "A five-factor asset pricing model". The sources in his answer build up and extend the following economic explanation.


Whereas the initial Fama/French (1992/1993) size- and value-factor was a purely empirical factor-model for expected stock-returns, the profitability factor RMW is theoretically based on the Dividend-Discount model:

$$m_t = \sum_{\tau = 1}^{\infty}{\operatorname{E}(d_{t+\tau}) / (1+r)^{\tau}} \tag{1}$$

where $m_t$ denotes the share price at time $t$, $\operatorname{E}(d_{t+\tau})$ is the expected dividend per share for period $t + \tau$ and $r$ is the long-run average expected stock return. Based on Modigliani/Miller (1961), we can rearrange eq. (1) to

$$ \frac{m_t}{B_t} = \frac{\sum_{\tau = 1}^{\infty}{\operatorname{E}(Y_{t + \tau} - \Delta B_{t+\tau}) / (1+r)^{\tau}}}{B_t} \tag{2}$$

where $Y_{t + \tau}$ is total equity earnings for period $t+\tau$ and $\Delta B_{t+\tau} = B_{t+\tau} - B_{t+\tau -1}$ is the change in total book equity.

Their intended risk-based explanation for the profitability factor is very subtle included in the following statement on p. 2:

[...] Next, fix $m_t$ and the values of everything in (3) [this is eq. (2) above], except expected future earnings, higher expected earnings imply a higher expected return.

That higher expected future earnings result in higher expected returns is quite mechanical to ensure that the numerator maintains its level. The risk-based explanation is actually incorporated in the assumption fix $m_t$.

Example:

Assume to firms A and B having the same market-valuation $m_t$, book-value of equity $B_t$ and change in book-value of equity $\Delta B_t$. Firm A however will have higher expected future earnings than firm B, so $Y_{t+\tau}^A > Y_{t+\tau}^B$ for any $t + \tau$.

Firm A is riskier than firm B because despite firm A having higher expected future earnings, it has the same market-valuation $m_t$ as firm B.


Summary:

High profitable firms should yield high expected future stock-returns. This may contradict any risk-based explanation at first glance. However, it is all about high profitability (high future expected earnings), which is not rewarded with a higher market-valuation by investors.

$\endgroup$
4
  • $\begingroup$ I have reviewed the FF article, and they define the profitability factor as revenues minus different expenses, divided by book value. This definition seems to be completely orthogonal to market-valuations, is it not? It encompasses the cases both rewarded and not rewarded by market valuations, but still expects some premium for this. $\endgroup$ Commented Jun 25, 2020 at 13:33
  • $\begingroup$ Due to the construction of the overall factor returns based on several subportfolios, they are not orthogonal to market-valuations, beta, etc. You may see this answer which arguments holds to the OP factor series in a similar way. $\endgroup$ Commented Jul 1, 2020 at 6:26
  • $\begingroup$ No-no, I'm saying that the definition of profitability factor does not constrain/regulate this on the formed portfolios. This is exactly what doesn't add up for me in your explanation: market valuations and beta can be anything, but not necessarily not-rewarding as you have put it. Do I miss something? $\endgroup$ Commented Jul 2, 2020 at 16:58
  • $\begingroup$ I think i now understand your comment, it is a very valid point! Take a look at the construction of the profitability-factor portfolio construction here. The RMW factor return is the hedge-portfolio of small robust and big robust minus small weak and big weak sorted stocks. The overall return is highly significant positive, and the portfolio construction ties profitability with firm size. Nevertheless, OP on its own does not reflect size, that's why the intersection with size is implemented too. $\endgroup$ Commented Jul 9, 2020 at 11:40
0
$\begingroup$

After some research, I've stumbled upon a 1996 paper "Multi-factor explanations of asset pricing anomalies" by FF themselves, which states that this is a question that did not have an academic consensus at the time of publishing.

I'll mark this as the answer if there is no more recent suggestions.

$\endgroup$
1
  • 3
    $\begingroup$ There was much research done since 1996 on profitability and a risk-based explanation for this effect. I will provide an answer tomorrow, since my profitability on a sunday is quite low... $\endgroup$ Commented Jun 21, 2020 at 14:38

Your Answer

By clicking “Post Your Answer”, you agree to our terms of service and acknowledge you have read our privacy policy.

Not the answer you're looking for? Browse other questions tagged or ask your own question.