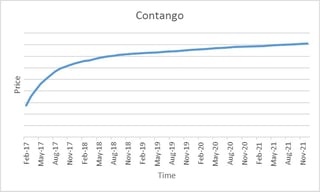
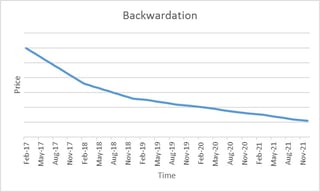
OK, so PHYSICAL commodities typically have a term structure for one of two basic reasons:
(1) that commodity is seasonal in nature. Take a look at the NatGas strip for the next 5 years. Ditto vagaries in the harvest of Brazilian coffee, Iowa wheat, or Florida FCOJ (a la Trading Places).
(2) sometimes, that term structure is not purely seasonal. NatGas clearly is seasonal in nature, but something above the cost of storing it (it can't be put in a tank, it will leak with any cracks, and it is explosive) creates a "convenience yield" whereby future prices are habitually priced to be lower. This was John Maynard Keynes's explanation for backwardation in his day. Producers were incentivised to lock in a price.
As you say, neither of these applies with respect to the VIX (or any other financial future, for that matter). The closest you can come is a fire-sale around a current expiry, akin to what drove front-month oil prices negative last year, while next-month remained low, but resolutely positive!
For stocks, bonds, and commodities, this term structure is a simple function of interest rates forwards. Interest rate forward curves can (and often are) "humped"; but this isn't evidence of anomaly.
VIX is "somewhere in between", by which I mean that the volatility is both traded for the next three months, and over them as well. Let's pack this out... The front-month is March, the 2nd is April, the 3rd is May. All of those implieds are now-to-then, not the implied for April or for May.
So the backwardated curve is simply saying that investors believe that current levels of volatility are likely lower than their unbiased estimate of future vol. And vice versa, for contango. Their brokers' trading desks will be gamma-hedging this against their flows in the underlying. It isn't pure "mean reversion"... it's a "our clients aren't behaving like this much of the spike/crash is sustainable" measure. Because the back-end does rise/fall too; just not as much as shorter-dated.
If you are of an econometric mindset (and most aren't ;-), then are inferring from Feb, Mar, and Apr options and their implieds, a Feb, Mar and Apr period-end vol. The shape of that latter curve is essentially then a bet on the autoregressive nature of vol, and "equilibrium" (haha) in May. How long does a "disturbance in the Force" linger? Or how long should any adjustment to one's Bayesian inferences about the nature of asset price behaviour remain priced?
Sorry (and I am NOT trivialising), but your signal from VIX futures question does ultimately come down to a call on Bayes-vs-Vader. Sorry that is actually too simplistic - it's white-noise versus Vader versus Bayes in full model disclosure ;-( Before you complain, these are just metaphors for pure randomness versus Markov-state-regimes versus machine learning 101. All of these being essentially philosophies, compatible enough with the data to remain un-disprovable.
Going back to the start, you have front, 2nd and 3rd month. Which gives you a level (the average), a slope (the regression), and a curve (the quadratic). Each of those will (likely) be a ton less correlated than 1st, 2nd, 3rd - so multicollinearity issues diminished. Work your model on those...
hope this helps,
DEM


