I am writing my Master Thesis on momentum strategies including price momentum (UMD/MOM) and two fundamental momentum strategies (SUE and CAR3). Right now I'm trying to create the three momentum factors in order to compare their performance from 1975-2012. The UMD/MOM factor is a factor already constructed by Fama-French. The documentation can be seen on French' website: https://mba.tuck.dartmouth.edu/pages/faculty/ken.french/Data_Library/det_mom_factor.html
I follow the method of Fama-French when constructing the MOM factor and then I try to follow the exact same procedure when creating the SUE and CAR3 factors, just like Robert Novy-Marx in his article "Fundamentally, Momentum is Fundamental Momentum" from 2015: http://rnm.simon.rochester.edu/research/FMFM.pdf. My data is collected directly from WRDS to R by following this code: https://drive.google.com/file/d/0BxvBvE2V-dFTVnZuLUFhZWNuazA/view?fbclid=IwAR0-uPDl1-kzRyugIVePTtIFxMiM5jQbbWqE9VxIdMftrs4adJ_zDGuh4Go
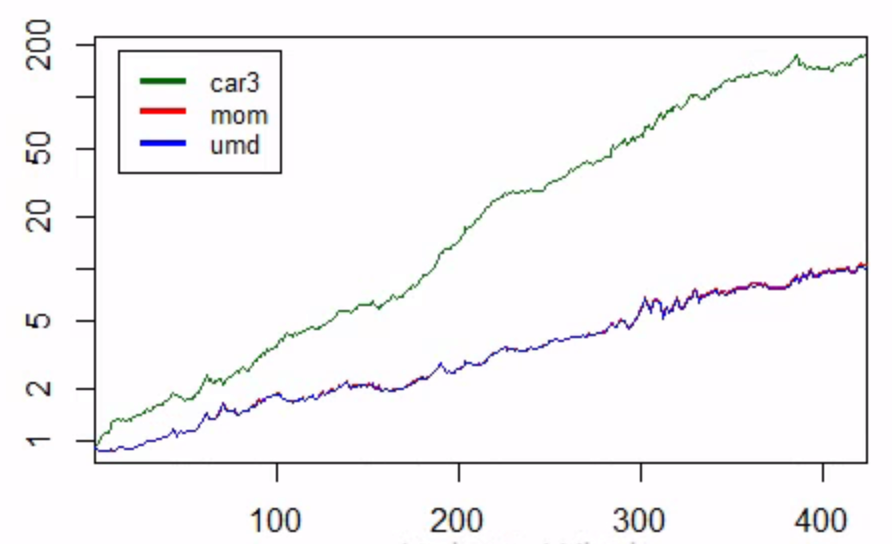
Novy-Marx (2015) creates a figure of the factors performance on p. 9 which is the figure I aim to replicate. My results of MOM and CAR3 are very similar to Fama-French and Robert. The figure bellow is my results, where the UMD factor is the one I have constructed and the MOM factor is the one I downloaded from Fama-French. This clearly showed that I have been able to replicate the UMD factor almost 1:1 and CAR3 is also very similar to Novy-Marx (2015).
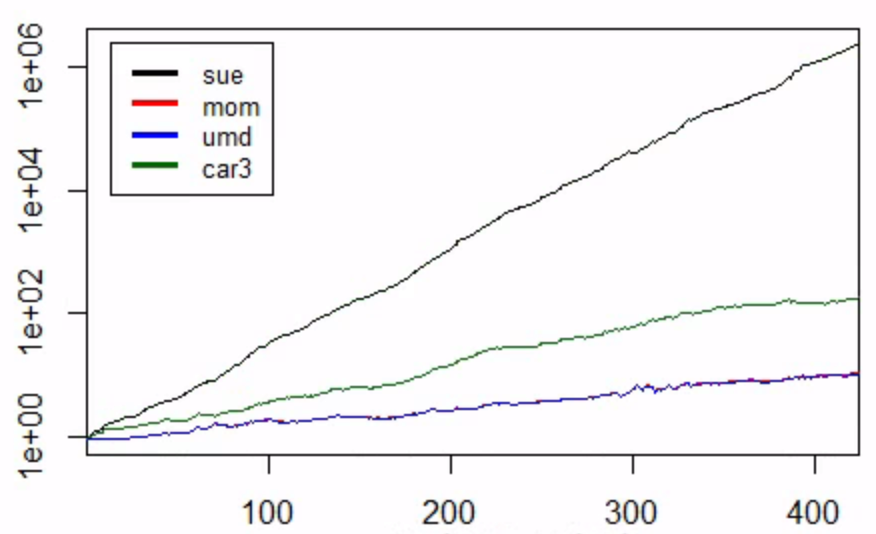
However, when I include SUE to the graph it results in this:
But as you see SUE is unrealistically high. Since the procedure of constructing the performance of the factors are exactly the same as for UMD and CAR3 it implies that the problem must be in relation to my calculation of SUE itself. I therefore need some help with examining where exactly the problem occurs.
When calculating SUE I follow Novy-Marx (2015). He defines SUE as "the most recent year-over-year change in earnings per share, scaled by the standard deviation of the these earnings innovations over the last eight announcements, subject to a requirement of at least six observed announcements over the two year window.". I'll try to write step by step what exactly I do:
Step 1: I download Quarterly data from Compustat, including the variables DATADATE, GVKEY and EPSPXQ (Earnings Per Share (Basic) / Excluding Extraordinary Items).
res <- dbSendQuery(wrds,"select gvkey, datadate, epspxq from comp.fundq
           where INDFMT='INDL' and DATAFMT='STD' and CONSOL='C' and POPSRC='D'")

comp.fundq <- dbFetch(res, n = -1)
Step 2: I arrange the data by datadate and gvkey to make sure the data is arranged in the right order before lagging EPSPXQ by 4 quarters.
comp.data <-
  comp.data %>%
  arrange(datadate, gvkey) %>%
  group_by(gvkey) %>%
  mutate(lag.eps = dplyr::lag(epspxq, n = 4, default = NA))
Step 3: I calculate Earnings Innovations by
comp.data$ei <- comp.data$epspxq-comp.data$lag.eps
Step 4: I calculate the rolling std. deviation of the earnings innovations calculated in step 3 over the last 8 announcements (width = 8) with a criteria where at least 6 observations of non NAs are required (Partial = 6)
FUN <- function(x) if (length(na.omit(x)) >= 6) sd(x, na.rm = TRUE) else NA
roll1 <- function(z) rollapplyr(z, width = 8, FUN = FUN, fill = NA, partial = 6)
comp.data <-
  comp.data %>%
  arrange(datadate, gvkey) %>%
  transform(comp.data, roll1 = ave(ei, gvkey, FUN = roll1))
Step 5: I calculate SUE by
comp.data$sue <- comp.data$ei/comp.data$roll1
Step 6: I download CCM data from WRDS as a step to merge Compustat Data with CRSP Data:
res <- dbSendQuery(wrds,"select GVKEY, LPERMNO, LINKDT, LINKENDDT, LINKTYPE, LINKPRIM
                    from crsp.ccmxpf_lnkhist")

ccm <- dbFetch(res, n = -1)
Step 7: I merge my Compustat dataset comp.data (incl. my new SUE variable) with CCM:
ccm.comp <-
  ccm %>%
  filter(linktype %in% c("LU", "LC", "LS")) %>%
  filter(linkprim %in% c("P", "C", "J")) %>%
  merge(comp.data, by="gvkey") %>%
  mutate(datadate = as.Date(datadate),
         permno = as.factor(lpermno),
         linkdt = as.Date(linkdt),
         linkenddt = as.Date(linkenddt),
         linktype = factor(linktype, levels=c("LC", "LU", "LS")),
         linkprim = factor(linkprim, levels=c("P", "C", "J"))) %>%
  filter(datadate >= linkdt & (datadate <= linkenddt | is.na(linkenddt))) %>%
  arrange(datadate, permno, linktype, linkprim) %>%
  distinct(datadate, permno, .keep_all = TRUE)
Step 8: I clean my data after the merge:
ccm.comp.cln <-
  ccm.comp %>%
  arrange(datadate, permno) %>%
  select(datadate, permno, sue) %>%
  mutate_if(is.numeric, funs(ifelse(is.infinite(.), NA, .))) %>%
  mutate_if(is.numeric, funs(round(., 5)))

ccm.comp.cln$datadate <- strptime(as.character(ccm.comp.cln$datadate), "%Y-%m-%d")
ccm.comp.cln$datadate <- format(ccm.comp.cln$datadate,"%Y%m")
Step 9: I load in CRSP data and clean it the same way as Fama-French: " "... all CRSP firms incorporated in the US and listed on the NYSE, AMEX, or NASDAQ that have a CRSP share code of 10 or 11 at the beginning of month t, good shares and price data at the beginning of t, and good return data for t". This includes the handling of delist returns as well.
Step 10: I merge my CCM-Compustat data with my CRSP data:
na_locf_until = function(x, n) {
  l <- cumsum(! is.na(x))
  c(NA, x[! is.na(x)])[replace(l, ave(l, l, FUN=seq_along) > (n+1), 0) + 1]
}

crsp.comp <- merge(x = crsp.data, y = ccm.comp.cln, by.x = c("permno", "date"), by.y = c("permno", "datadate"), all.x = TRUE)
Can anyone help me identify where a problem could occur?


