0
$\begingroup$

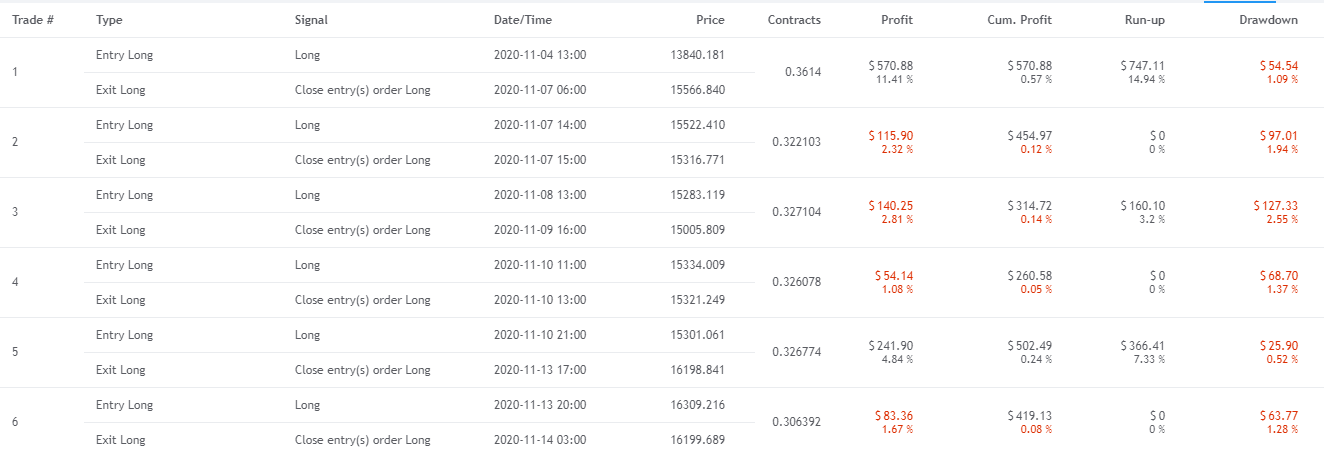
I tried to backtest a simple strategy on TradingView, it made 6 trades with these results: enter image description here Now I want to calculate Sharpe ratio using definition provided by TradingView. So, my daily returns(profit_by_days) equals:
2020-11-07    0.45
2020-11-08    0.00
2020-11-09   -0.14
2020-11-10   -0.05
2020-11-11    0.00
2020-11-12    0.00
2020-11-13    0.24
2020-11-14   -0.08

Using this Pandas code:

sharpe = (profit_by_days.mean() - (2/365))/profit_by_days.std(ddof=0)

I get 0.257 Sharpe ratio, while TradingView shows 0.205.

Why did I get a different result?

$\endgroup$
6
  • $\begingroup$ How does this work? In your first table, on november 9 you made 2.81%, but in the profits_by_days on november 9 you have a loss of 14%. $\endgroup$
    – nbbo2
    Commented May 18, 2021 at 0:48
  • $\begingroup$ the profit_by_day is following the cum.profit column I believe, amd it is in decimal, not percenage so it is actually 14bp of profit if i understod correctly, and not 14% $\endgroup$
    – Mayeul sgc
    Commented May 18, 2021 at 8:09
  • $\begingroup$ @noob2 if trade profit is red, then it's loss. $\endgroup$ Commented May 19, 2021 at 20:49
  • $\begingroup$ @Mayeulsgc I think, this column(and profit_by_days) shows (absolute_profit_of_trade * 100) / capital. What do you mean by amd and bp? $\endgroup$ Commented May 19, 2021 at 21:08
  • $\begingroup$ @noob2 still can't figure out what is going wrong. Do you have suggestions? $\endgroup$ Commented May 20, 2021 at 23:14

0

Your Answer

By clicking “Post Your Answer”, you agree to our terms of service and acknowledge you have read our privacy policy.