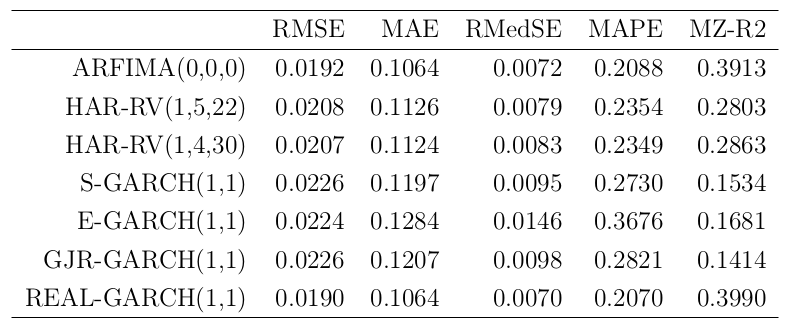
You can compare the losses against each model and determine the "best" model to be the one with the smallest losses. In many cases for larger studies, the results might be ambiguous where one or more models are favored by different loss functions. Therefore, we want to know if we can construct statistical tests that evaluates the significance of the performance, based on the loss differences between the models. It turns out that we can, and it has been studied extensively within academia.
Forecast comparison analysis:
When we want to do a forecast comparison analysis, there is one thing we want to do: testing whether the forecast difference is statistically different from zero. If we let $L(\theta_t, \Sigma_{it})$ be your loss function (just think QLIKE or MSE) with $\Sigma_{it}$ be your covariance estimate for model $i$ at time $t$ and $\theta_t$ is your robust proxy (since volatility is latent). Then the loss difference can be defined as $d_{ij,t}=L(\theta_t, \Sigma_{it}) - L(\theta_t, \Sigma_{jt})$ with a corresponding constructed null hypothesis:
$$H_0: \quad \mathbb{E}\left[d_{ij,t}\right] = 0, \qquad \forall \: t.$$
Constructing the test-statistic, we need the standard error which is usually found by bootstrapping the loss-differences and then calculating the bootstrapped standard error (Intuitively and under enough regularity, the bootstrap standard error will be close to the population standard error). Be aware that the (composite) null hypothesis can differ slightly between each comparison method.
This is the starting point of many forecast comparison tests including the well-known Diebold-Mariano test, which is a pair-wise forecast comparison test. There exists a plephora of different forecast comparison methods, where most of them focus on comparing multiple out-of-sample forecasts at once. Before listing most of them, I want you to consider reading two articles that investigates different volatility models (measures) using forecast comparison methods:
Hansen, Peter R., and Asger Lunde (2005). "A forecast comparison of volatility models: does anything beat a GARCH (1, 1)?". In this paper, the authors use multiple forecast comparison analyses to determine whether compare 330 ARCH-type models outperform a vanilla GARCH(1,1) model. It will provide you with great insight into the usage of forecast comparison methods.
Liu, Lily Y., Andrew J. Patton, and Kevin Sheppard (2015). "Does anything beat 5-minute RV? A comparison of realized measures across multiple asset classes.". In the same flavour of the above article, Liu et al. compares the 5-minute realized variance to a set of alternative realized measures of intraday volatility on a large set of assets. This paper also uses a variety of different multiple forecast comparison methods, including the Diebold-Mariano test. The article is very applied, but will definitely peak your interest!
The theoretical background for many of the forecast comparison methods is quite extensive and hard to comprehend. Thus, people tend to pick a few of the methods and get far by understanding the intuition and results behind them. From the many articles I have read, the Diebold-Mariano test is the favorite for pair-wise comparison and The Model Confidence Set for multiple forecast comparison.
Listing different forecast comparison methods:
Diebold-Mariano test: Diebold, Francis X., and Robert S. Mariano (2002). "Comparing predictive accuracy." They made an updated paper responding to their original paper by detailing the use and abuse of the test.
White's test (Reality check or RC): White, Halbert (2000). "A reality check for data snooping." As described in the first article above, the RC test "lacks" in power and has a hard time distinguishing between "good" and "bad" forecasts.
Hansens Superior Predictive Ability (SPA): Hansen, Peter Reinhard (2005). "A test for superior predictive ability." This forecast comparison method is more robust to the inclusion of poor forecast in contrast to RC.
Romano-Wolf test: Romano, Joseph P., and Michael Wolf (2005). "Stepwise multiple testing as formalized data snooping." This is similar to SPA, however the primary difference is that the Romano-Wolf test identifies the set of models that are better than the benchmark, whereas the SPA asks the question whether any forecast is better than the benchmark.
The Model Confidence Set (MCS) Hansen, Peter R., Asger Lunde, and James M. Nason (2011). "The model confidence set." Intuitively, this comparison test gives you a set of models within a given level of "confidence" where the selected models are "equal" in out-of-sample predictive ability. In my opinion, this is the most complicated forecast comparison method to understand from a theoretical perspective. In that regard, the authors also made another paper posing as a "guide" on using the MCS method and how to choose the best models. Here, they also lay an intuitive foundation for the test.
Multi-Horizon SPA & MCS: R. Quaedvlieg (2020), "Multi-Horizon Forecast Comparison." In this recent article, R. Quaedvlieg provide extensions of the SPA & MCS tests to jointly compare multiple horizon forecasts. He further concludes that the tests lead to more coherent results. Comparing model forecasts at many individual horizons independently, will implicitly give us a multiple testing problem that leads to more type 1 errors ie. false rejections of the null (implying that models can significantly differ at a given forecast horizon). As such, in finite samples we are likely to find that a mis-specified model will outperform even the population model at one of the many horizons one could consider. Comparing all horizons jointly guards us against this problem. The multi-horizon tests are not restricted to economics, but can also be used to compare climate forecasts at different horizons et cetera.
Kevin Sheppard has provided good graphical illustrations of the SPA, Romano-Wolf, and MCS tests in the arch package documentation. They are also implemented in his arch package.
I am by no means an expert on the forecast comparison methods detailed above. However, you can get far by understanding the intuition behind the methods (pick one or two out) and how to interpret the output. Understanding the theoretical results behind the tests are not needed in order to use them. I hope this helps.

