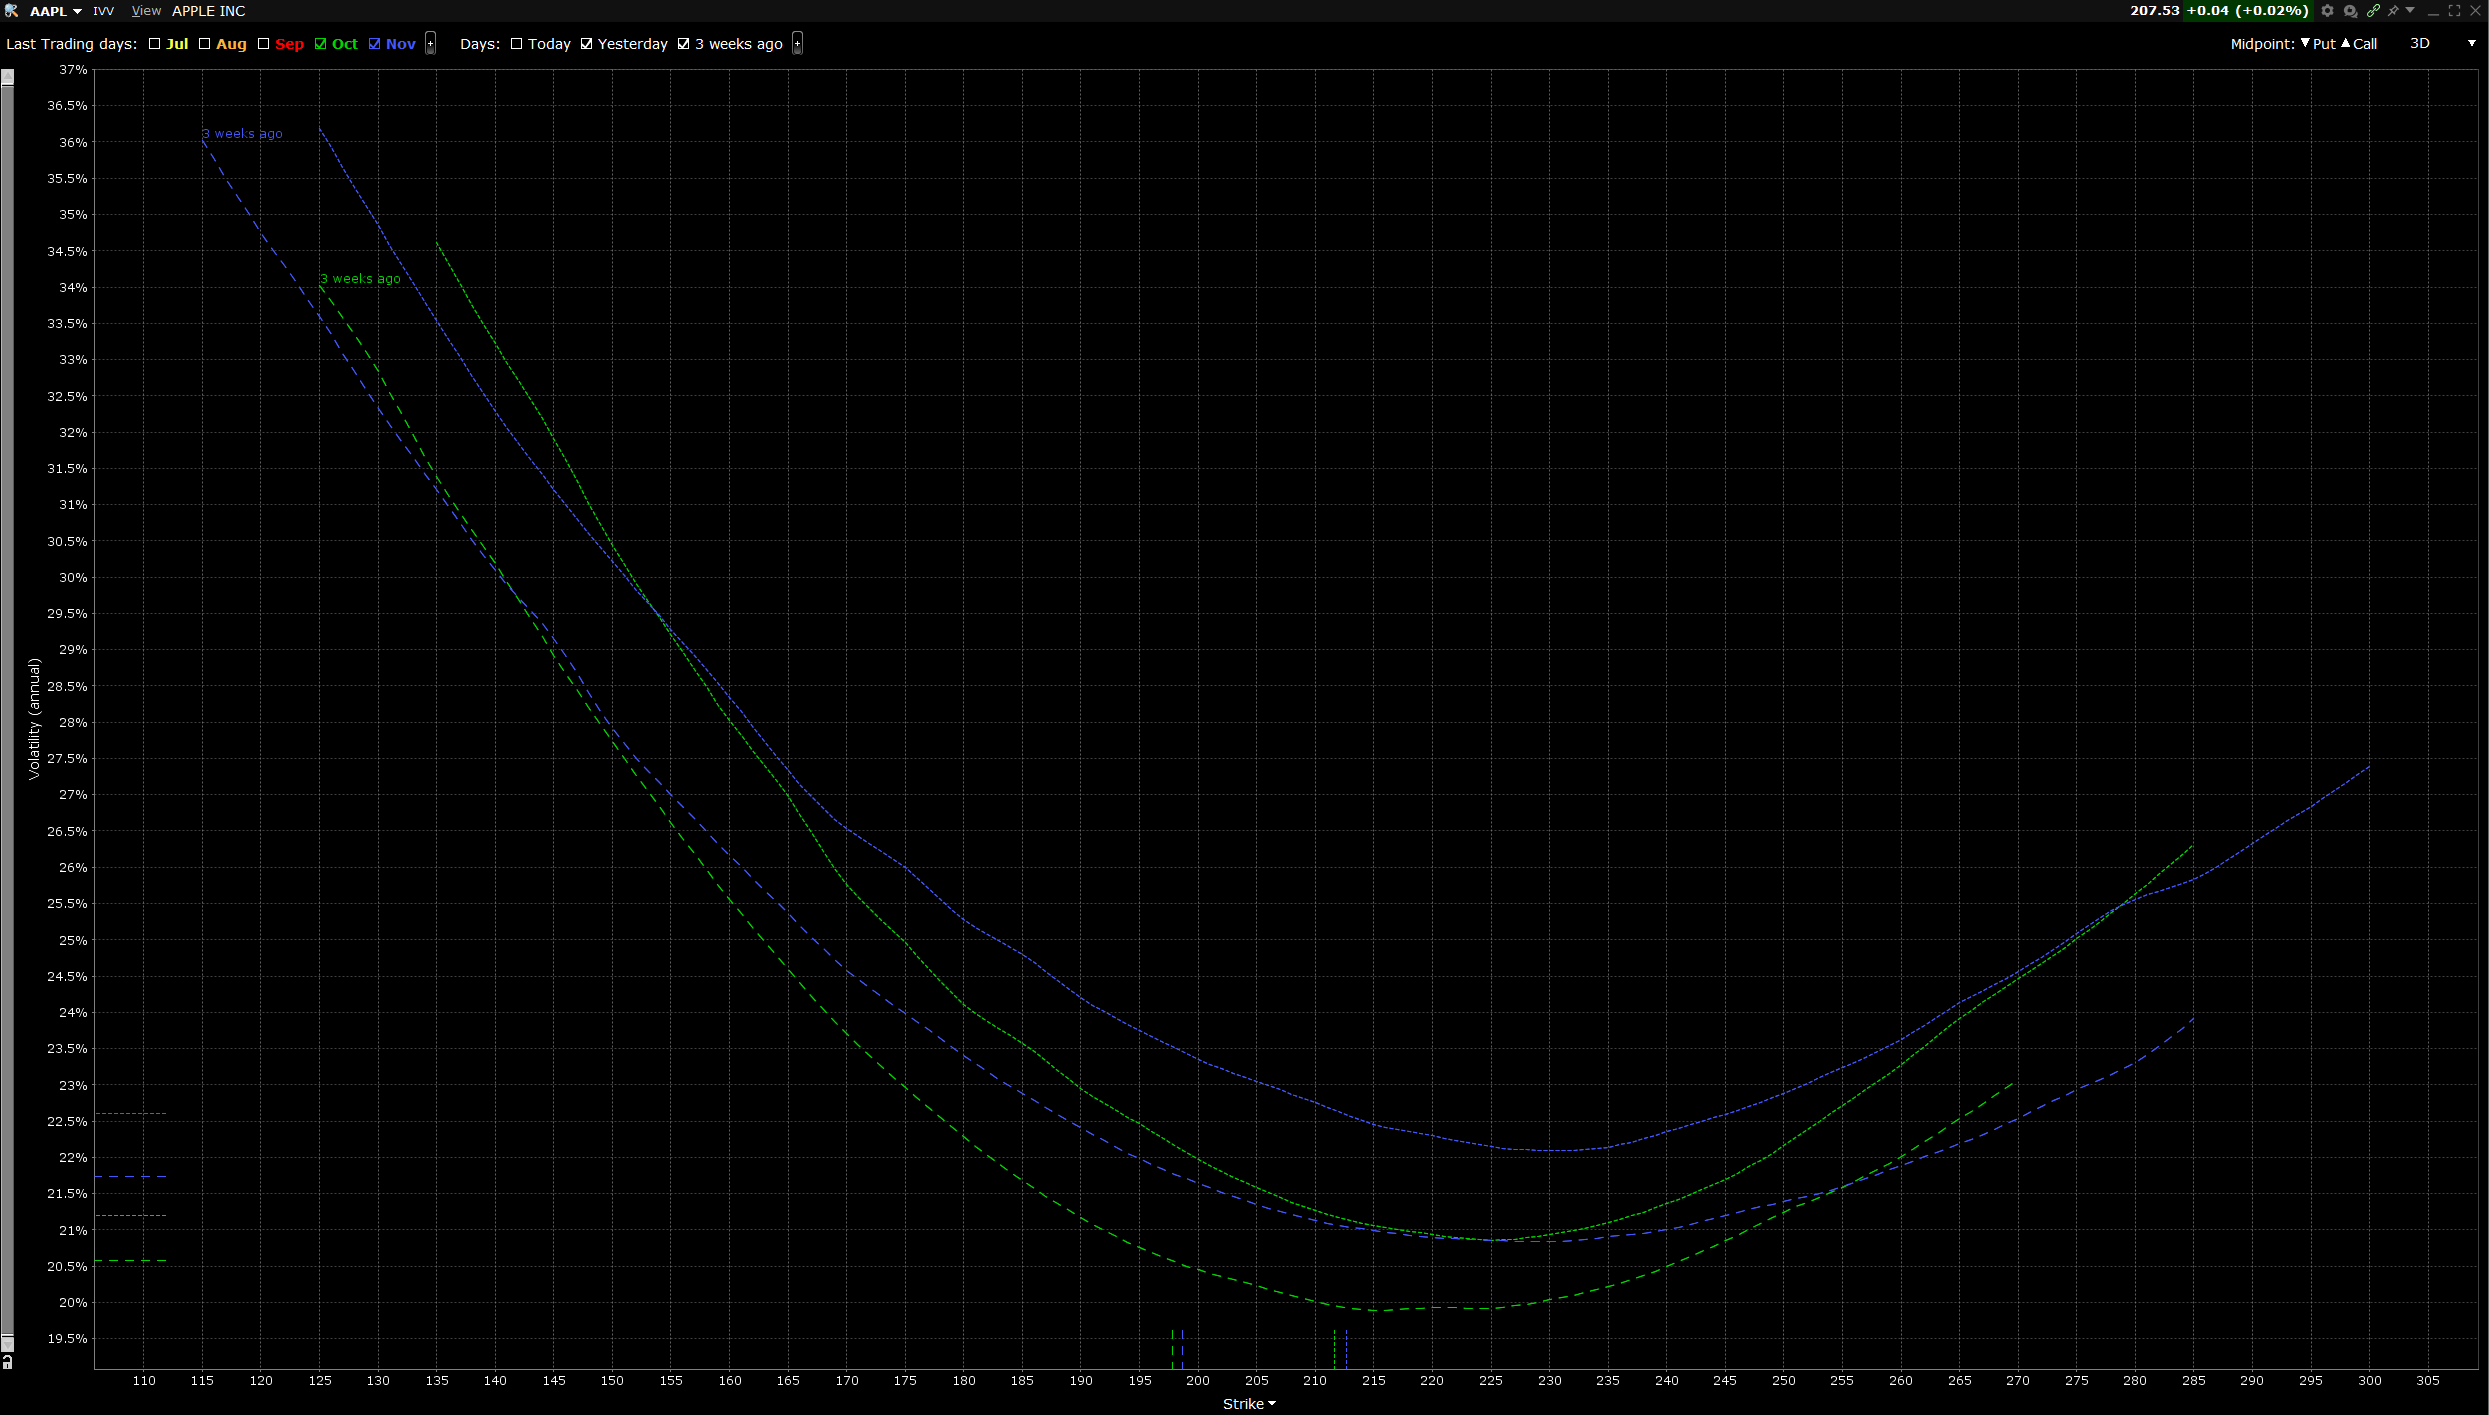
Below is a plot of AAPL vol vs. Strike for October and November, last market close vs 3 weeks prior. The plot shows that both curves shifted up by an approximately constant amount with the October term compressing a bit near the spot price. For every strike, vol is higher now than 3 weeks ago for both curves.
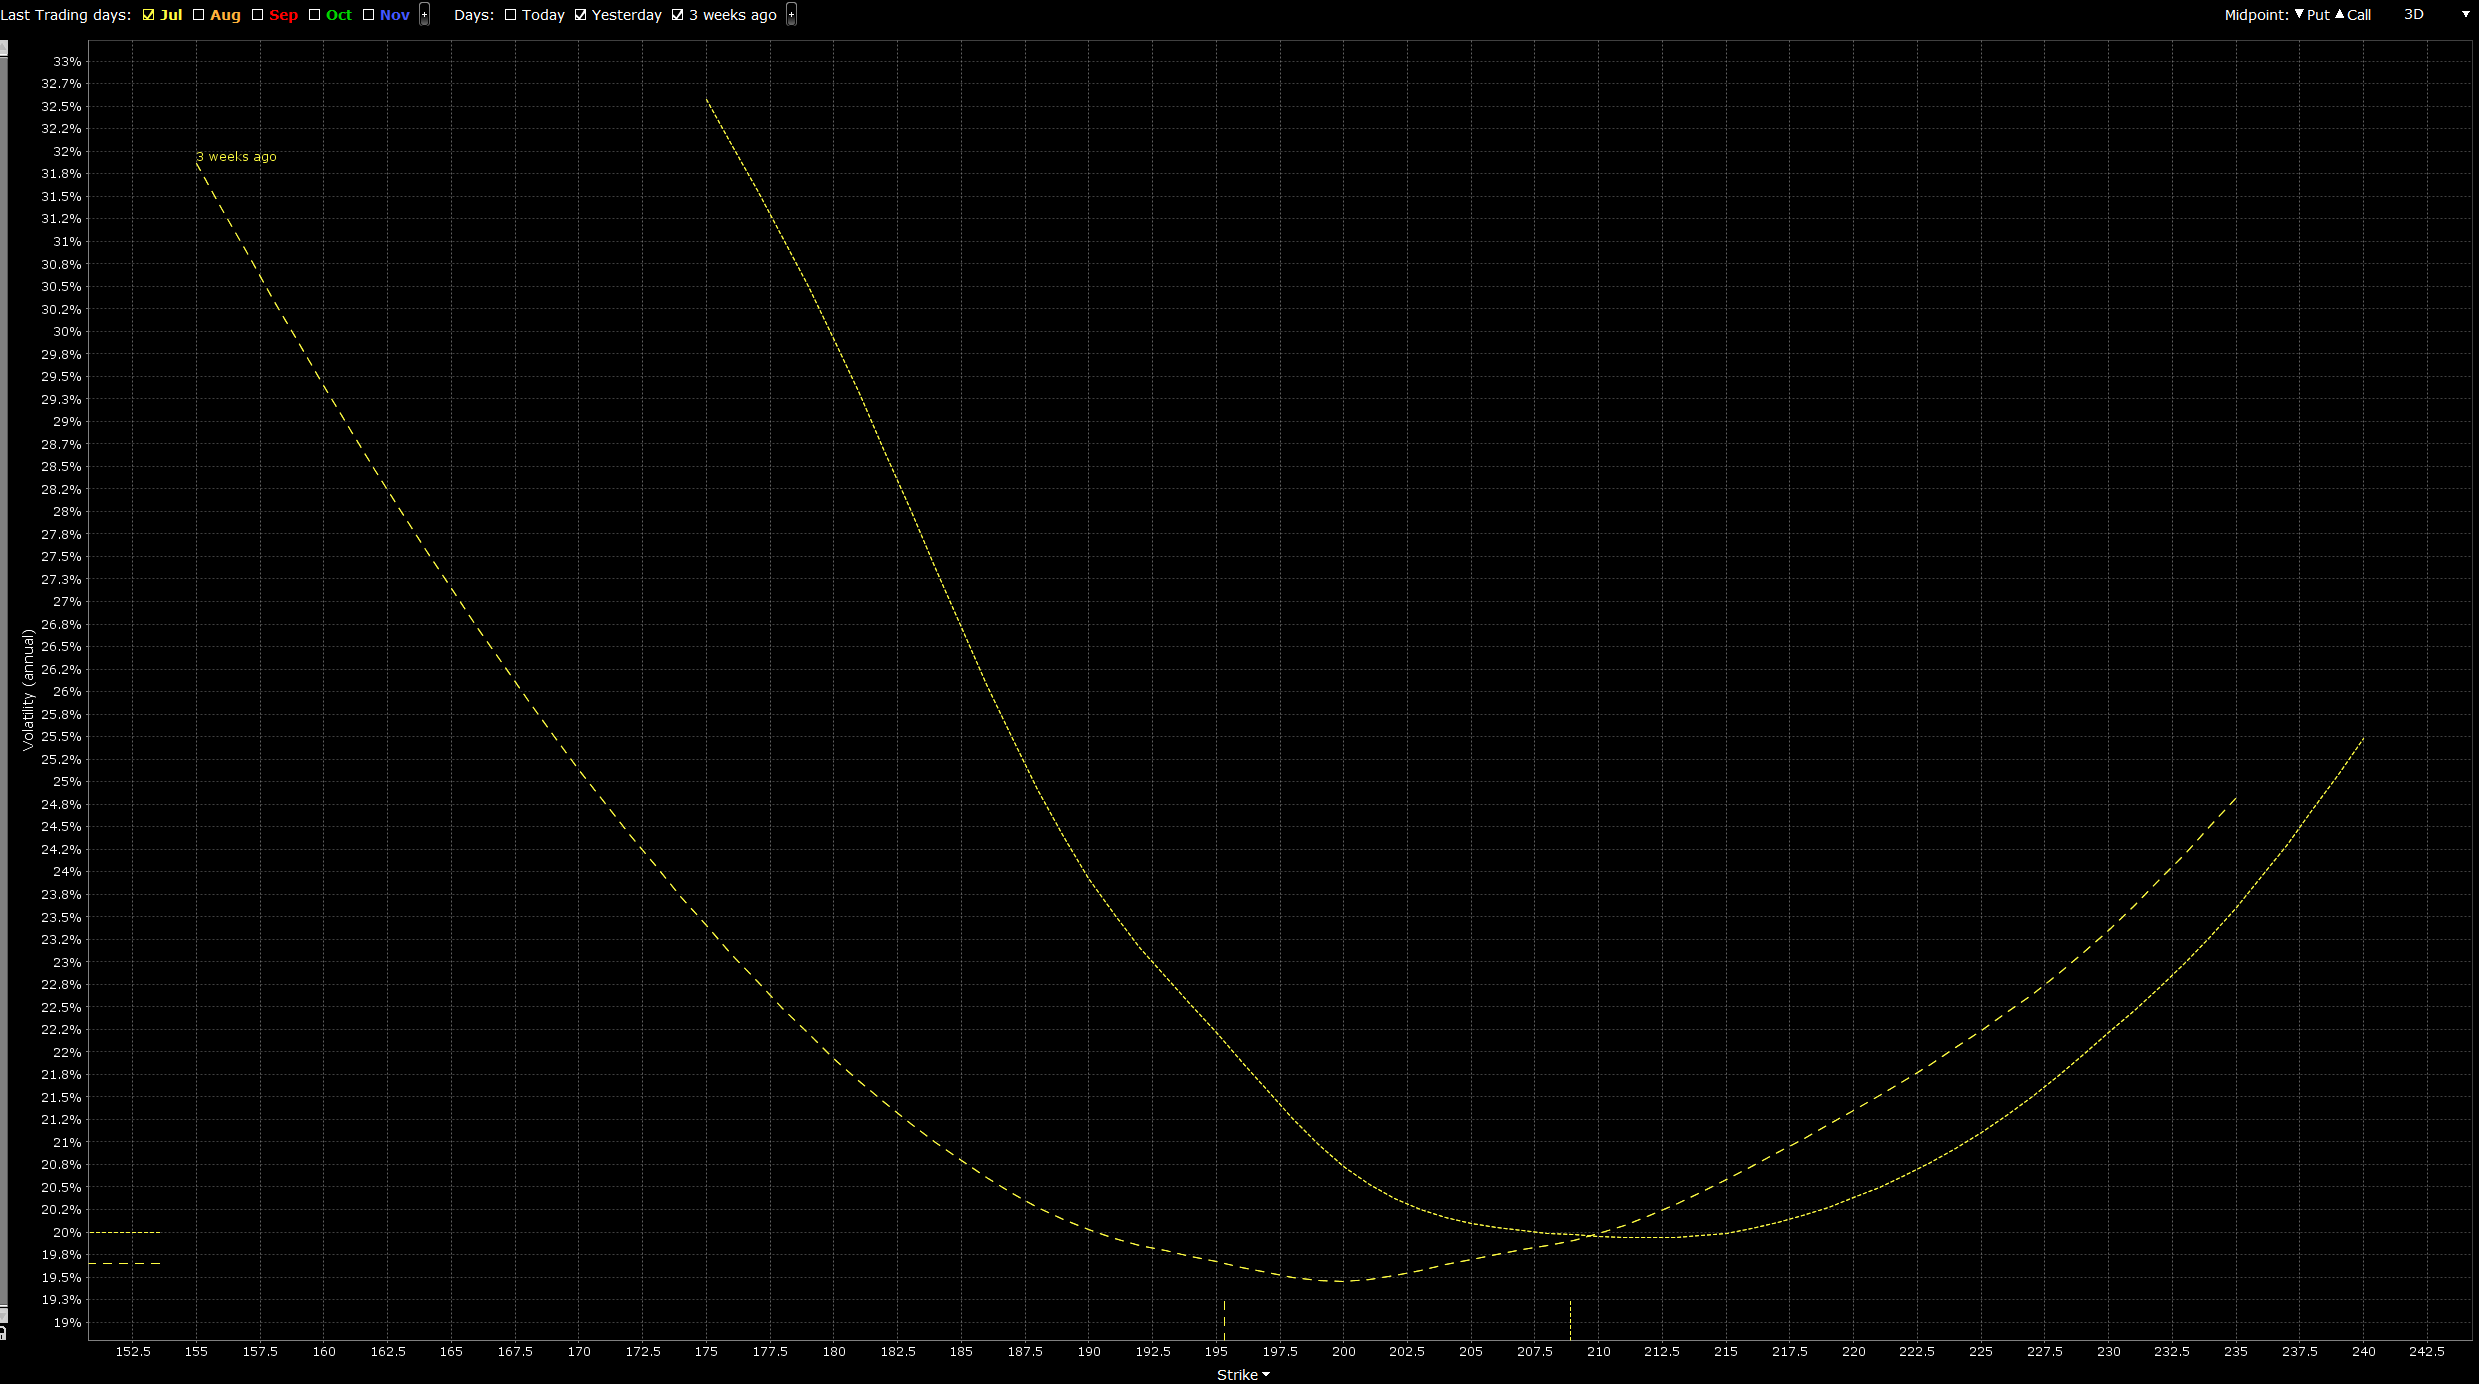
However, July looks very different. Strikes approximately below spot gained vol while strikes above spot lost vol. There was no parallel shift in vol similar to the later months (Aug, Sept, Oct, Nov). I was expecting a roughly root time movement in vol across the expirations with bigger moves occurring at the front month. Why does July look different? The next dividend is in August so it's not that. I see the same behavior in other stocks.


