It is always said that longer bonds are more sensitive to interest rates. Intuitively this makes perfect sense, since longer bonds have a larger portion of its cash flow being subjected to stronger interest rate adjustments, and thus their value must be more sensitive to interest rates.
When I tried to prove this quantitatively, things seem to get more complicated. Suppose a bond with par value $a$ pays coupons of amount $y$ annually. If interest rate is $r$, then the value of the bond is.
$$ P=\frac{y}{r}[1-\frac{1}{(1+r)^{n}}]+\frac{a}{(1+r)^{n}} $$
And the relative change in the bond price with respect to interest rate is
$$ \frac{1}{P}\frac{dP}{dr} $$ where $$ \frac{dP}{dr}=y\left\{ [1-(1+r)^{-n}](-r^{-2})-nr^{-1}(1+r)^{-n-1}\right\} -an(1+r)^{-n-1} $$ $$ =\frac{\frac{y}{r^{2}}(1+r-\frac{n}{r})-an}{(1+r)^{n+1}}-\frac{y}{r^{2}} $$ Therefore, $$ \frac{1}{P}\frac{dP}{dr}=\frac{y(1+r-\frac{n}{r}-(1+r)^{n+1})-anr^{2}}{\left\{ yr[(1+r)^{n}-1]+ar^{2}\right\} (1+r)} $$
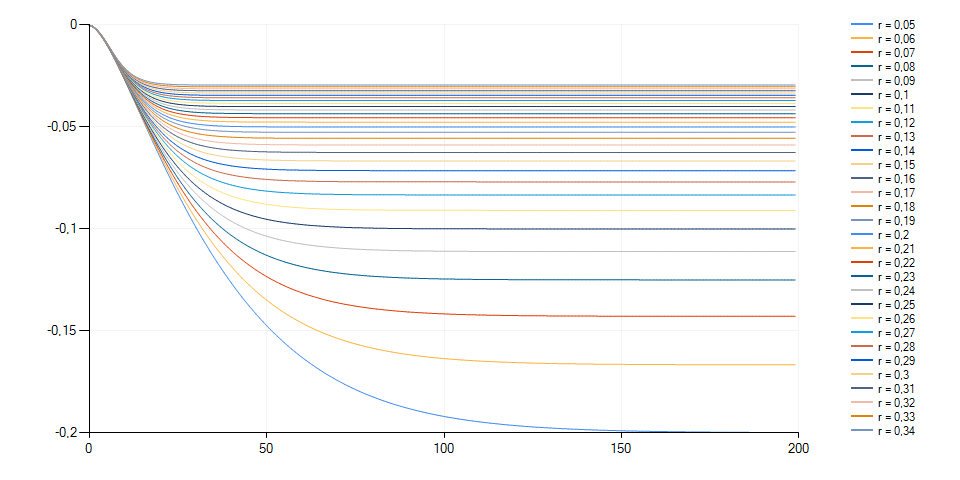
Suppose long term bonds are really more sensitive to interest rate changes, then the above equation should always be negative, and its value should decrease as n increases. But I am having trouble seem this from the above equation. In fact, numerical results suggest other wise:
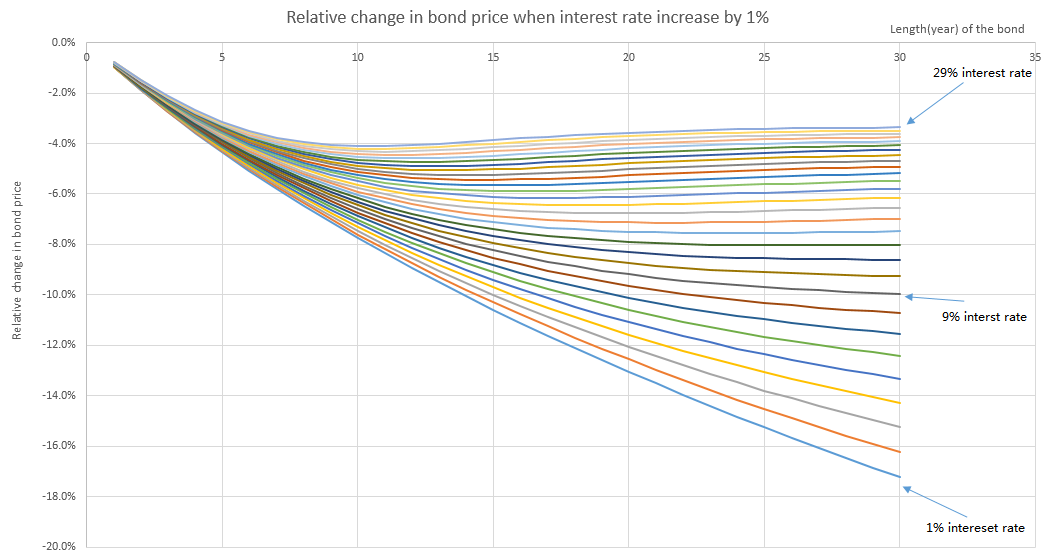
The chart above shows the percentage change in bond price when interest increases by 1%. The bond pays a 6% annual coupon. Each curve represents a bond that is subjected to a different interest rate. For example, the purple curve in the middle represents the relative change in the price of a bond that pays 6% coupon with interest rate being 9%. The vertical axis is the relative change in price, and the horizontal axis is the length of the bond.
We can see from the chart that initially bond price does decrease faster as length increases, but soon reaches a maximum rate of decrease, and eventually the rate seems to move back toward a limiting value.
This leaves 2 questions:
With regard to the saying that "longer bonds are more sensitive to interest rates", is this a statement that is true for most practical cases, or is it a statement that's always true mathematically?
How can we algebraically derive the results seen in the chart to answer questions such as where do the maximum rate of decrease occur, and what is the limiting value, if it exists at all?

