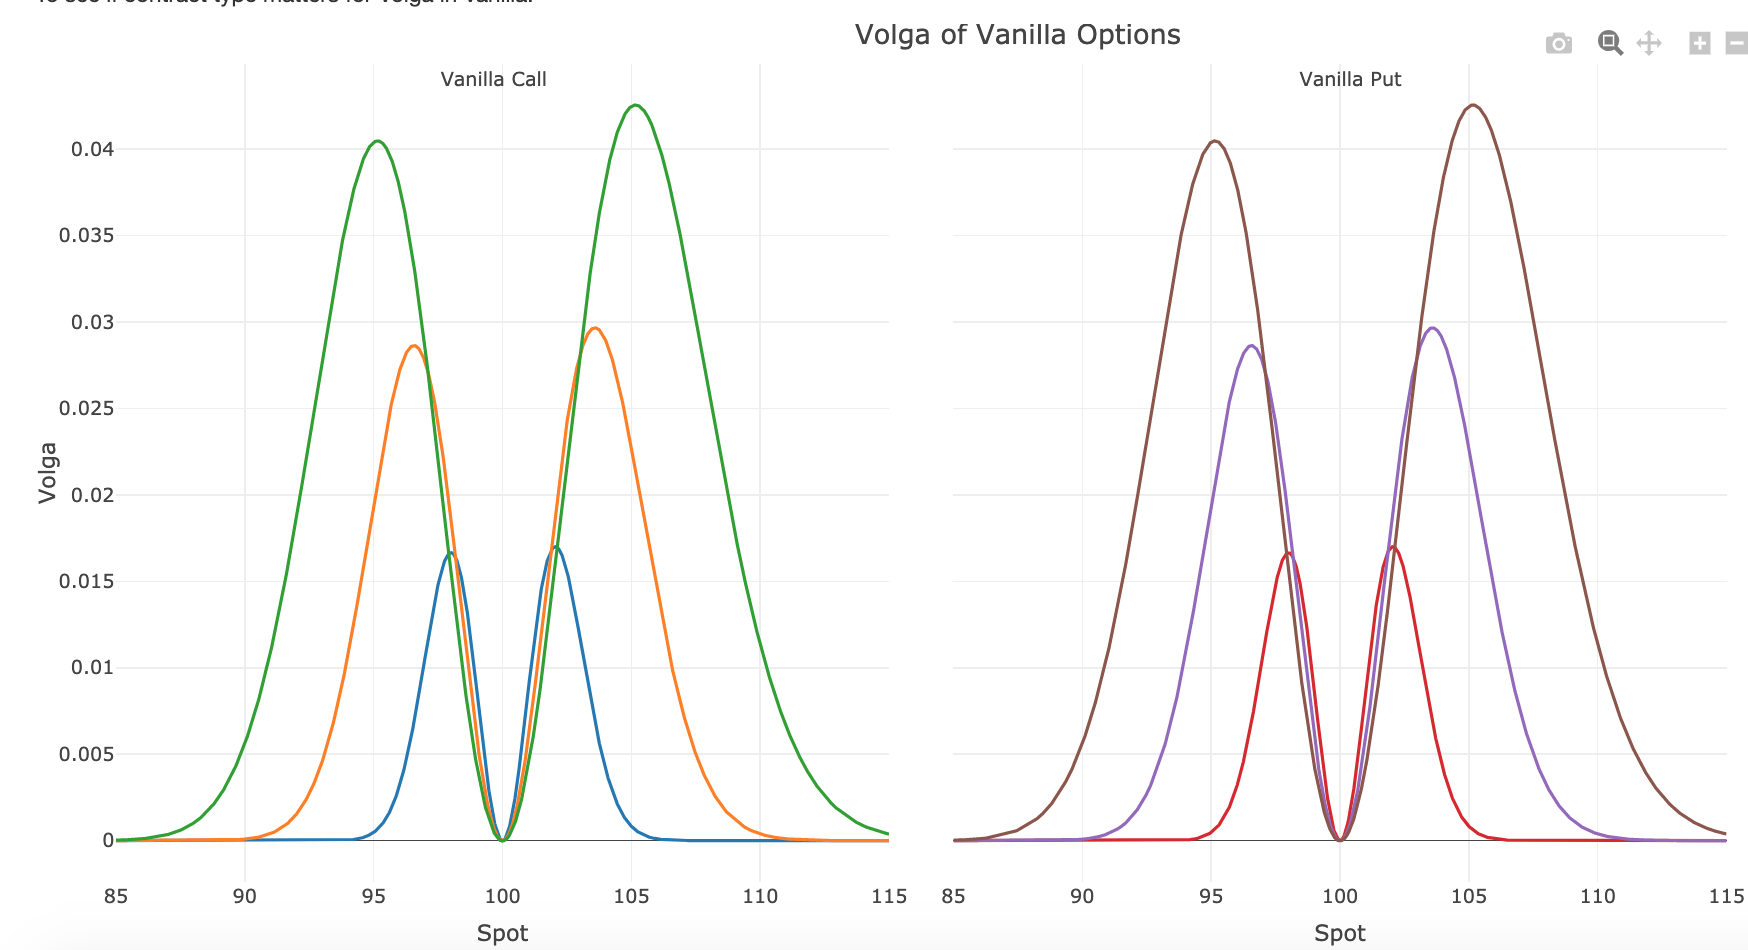
I've plotted the charts of Volga of Vanilla Call/Put using finite difference method, and found they are the same, and an asymmetrical shape of observed for both. Any intuitive way to explain the behaviour, or why ITM call/OTM put has higher Volga?
How to explain the asymmetry of vanilla Volga?
Ang Yiwei
- 139
- 5

