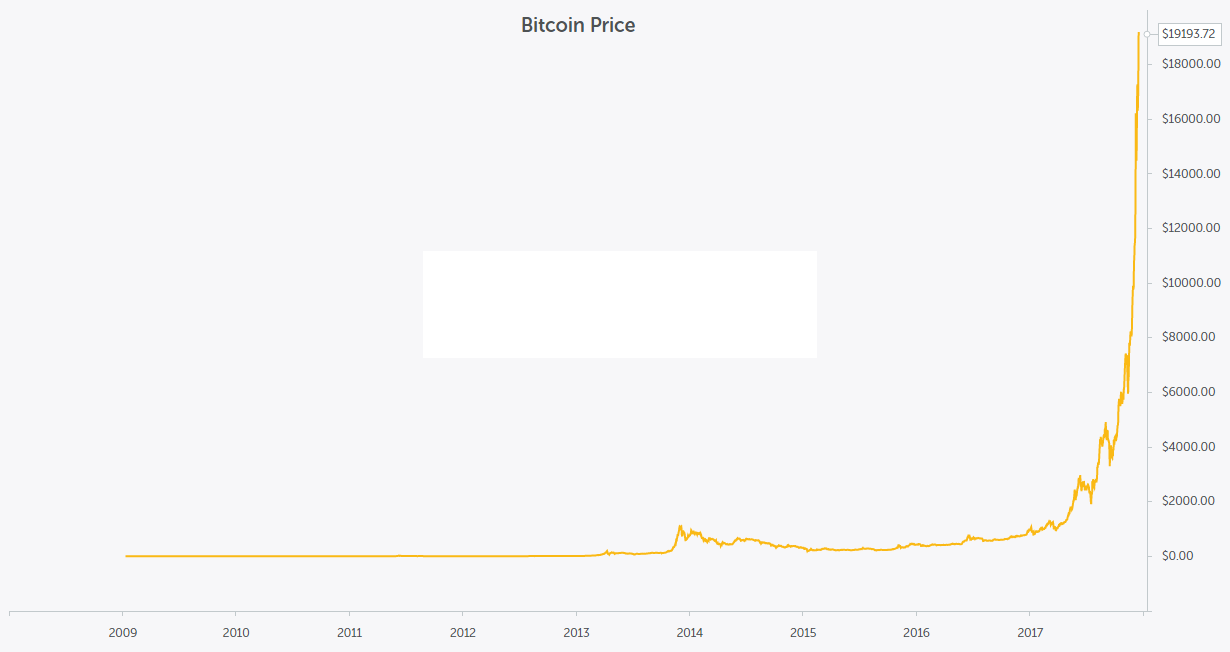
Surprisingly, I've found very little research on this topic. Research papers I've come across propose some simple models to say that asset prices might be in a bubble. Most of the models take these theoretical paths:
- propose SDEs not that different than traditional GBM or Ornstein-Uhlenbeck processes aside from additional terms which should capture the "collective psychosis" effect by using some exponential form or whatever. For instance, in this paper we see something like
$$\mathrm{d}P \left( t \right) = - \mu \left( 1 - e^{P_{0} - P \left( t \right)} \right)\mathrm{d}t + \sigma \mathrm{d}B_{t} + \nu S \left( P \left( t \right) - P \left( t - T \right) \right) \mathrm{d}t$$
- propose multiple regimes models and thus the artillery role is played by HMM algorithms (forward-backward, Viterbi, Baum-Welch). We're in a bubble if the probability of being in such a hidden state is larger than the probability of being in any other state (this paper can give some clues).
The problem is: none of these models is particularly useful for trading purposes. I would be interested in knowing what are the signs which an asset price should show while it's going into a bubble, not when it's already into one. Do you really need a SDE or a HMM to say that Bitcoin is currently in a bubble? I don't think so:
I guess your eyes can fit an exponential form even without OLS. Economists and fundamental analysts would say that «it's a bubble if you cannot justify such a price by any cash-flow-related property, like making earnings, fulfilling debt obligations or defending purchase power against inflation». I would answer them that if you cannot see cash-flow-related properties this doesn't mean that others cannot see it. Moreover, should we really care about what can justify such a price dynamic as long as we can take advantage of it?
Hence we come to my question:
What are the quantitative properties that an asset should meet to say that it has a large probability of going into a bubble?
From a practical point of view, this question can be represented like a game where you're provided with hundreds of thousands of OHLC time series belonging to every possible financial instrument and you're asked to create the most effective bubble-screener device. Every morning this device should tell you which asset prices have the largest probability to be at the beginning of an exponential rise. As tough quantitative guys, if you want to win the game you should outclass average Joe, whose only compass is: if a bubble has just begun on asset $x$, its price should have crossed its 200-day moving average... so average Joe screener catches every asset whose price has just crossed and somehow sorts.
How would you outclass average Joe by using quantitative models?

