44
$\begingroup$

What tools exist for order book analysis and visualization? In particular, if one wanted to examine a limit order book and understand how it changes throughout the day where would you turn for software help? I've not found anything off the shelf, but I'm curious if others in this community might know of something. My preference is for free/open source that are available for R or Python, but commercial tools are acceptable as well. My wish list would look something like this:

  • Order book visualization. Show the bids and asks in standard book form.
  • Order by order or level aggregation.
  • Order tracking through time.
  • "VCR style" controls that allow one to easily scan through the book across time.
  • Multiple venue support. Depth of book data from more than one venue is maintained as a separate book for a given instrument, but an aggregated "virtual" book can be displayed.
  • Descriptive statistics could be calculated across arbitrary time periods (# of orders added, deleted, etc.

Any suggestions on tools that might help in this type of analysis are welcome as are suggestions of features not listed here but that are provided by software packages available today.

$\endgroup$

9 Answers 9

18
$\begingroup$

I don't know why it was removed, but the R package "orderbook" was available:

http://journal.r-project.org/archive/2011-1/RJournal_2011-1_Kane~et~al.pdf

http://cran.r-project.org/web/packages/orderbook/index.html

In the IBrokers package, the function "reqMktDepth" is used for streaming order book data.

http://cran.r-project.org/web/packages/IBrokers/IBrokers.pdf

$\endgroup$
3
  • 2
    $\begingroup$ I think this is the package limitob. Perhaps they just renamed it? $\endgroup$ Commented Sep 9, 2011 at 15:25
  • 2
    $\begingroup$ @Louis, Same authors, same general description, you're probably right. $\endgroup$
    – bill_080
    Commented Sep 9, 2011 at 15:30
  • 2
    $\begingroup$ I'm out of votes, but never fear I won't forget and will vote up your answer in a few hours. $\endgroup$ Commented Sep 9, 2011 at 15:36
8
$\begingroup$

So one such visualization package is demonstrated in http://www.tradeworx.com/movie/booklet_demo/temp/booklet_demo2.mov. AFAICT it looks like a tk script.

Trading Technologies (TT) sells another visualization tool. But TBH writing your own tool takes a few hours and allows you to focus on what information you are interested in finding.

$\endgroup$
3
  • $\begingroup$ Nice link, thanks for sharing and welcome to quant.SE! I agree, building your own is not that hard, but I'm always interested to see what exists out there to get ideas. This is the best visualization I've seen, and the features for moving through the day are very nice. $\endgroup$ Commented Sep 11, 2011 at 12:21
  • $\begingroup$ If you enumerate your requirements, I'm pretty sure the quant.SE group could put together a nice viz that rivals the other apps :) $\endgroup$
    – Foo Bah
    Commented Sep 11, 2011 at 14:03
  • 2
    $\begingroup$ Link is dead :( $\endgroup$ Commented Dec 17, 2015 at 17:16
7
$\begingroup$

http://lobster.wiwi.hu-berlin.de/forum/viewtopic.php?f=4&t=30

R code, pictures and discussion, it's easy to modify it

$\endgroup$
2
$\begingroup$

I came across B/View which is a Java application that visualizes the order book for a single stock on a single day. It encompasses some of the basic features I would expect in such a tool. It appears to be more a demonstration than a general purpose tool.

$\endgroup$
2
$\begingroup$

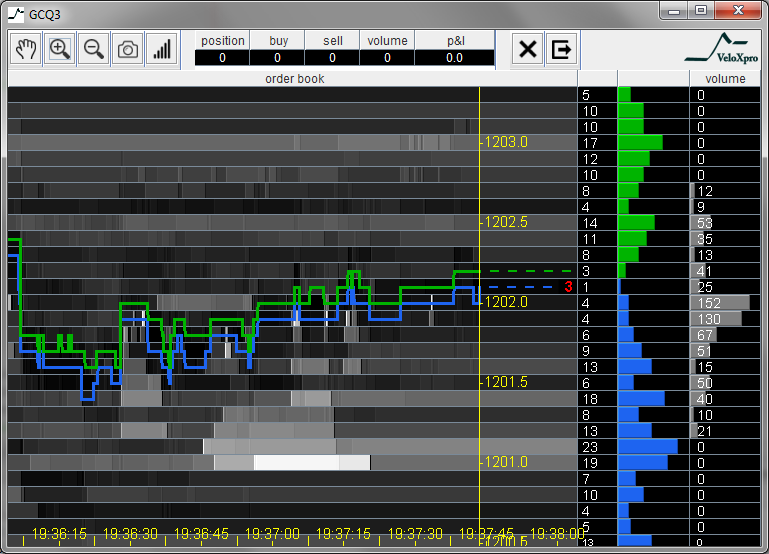
There is a new Order Book visualization tool, called BookMap: http://www.youtube.com/watch?v=1c6HegAn-CA

It allows to trade and simulate trading in real-time or replay mode. The replay mode is free to use. enter image description here

BookMap is the only tool, that visualizes the history (evolution) of the order book. (the first version will be soon in production)

$\endgroup$
2
$\begingroup$

BookMap seems cool, indeed.

  1. Jigsaw trading has something good, similar, less expensive http://www.jigsawtrading.com/order-flow-software/ The owner is a trader

This tool is used by profitable traders: http://www.nobsdaytrading.com/free-info/for-inexperienced-traders/

  1. DB Vaello from OrderFlow Analytics offers another great tool http://www.orderflowanalytics.com/get-ofa
$\endgroup$
1
$\begingroup$

The moderator Bob Jansen deleted my previous response without meaningful comment. Bob, please explain why highchart heatmap cannot be used to "order track through time".

The user asked for:

Order tracking through time.

My preference is for free/open source that are available for R or Python

You need a heat map to do that.

I recommended the Heatmap plugin for Highcharts. It is absolutely capable of everything that "Bookmap" (as recommened by Serg) does; as bookmap is really just another heatmap utility with a gui interface. I really have no idea why this was not an adequate response. Its even offered as a free web utility for trial and its compatible with python.

You can input an array to HTML field and adjust chart params in java field. Test free it here:

http://jsfiddle.net/gh/get/jquery/1.9.1/highslide-software/highcharts.com/tree/master/samples/highcharts/demo/heatmap-canvas/

$\endgroup$
0
$\begingroup$

Take a look a EclipseTrader.

$\endgroup$
4
  • $\begingroup$ Thanks for the link, but I don't think this really fits what I'm looking for. I'm more interested in a tool for exploration of the order book, not a trading platform. $\endgroup$ Commented Sep 9, 2011 at 0:56
  • $\begingroup$ Eclipse Trader is only an terminal, you need to connect it on a trade plataform in order to see the market data ( level one and level 2 ) $\endgroup$ Commented Sep 14, 2011 at 19:09
  • $\begingroup$ I have plenty of data. What I need is a tool to help me explore it. $\endgroup$ Commented Sep 14, 2011 at 21:12
  • $\begingroup$ Louis, there are some brokers here in Brazil using EclipseTrader as front end to offer market access, take a look: tryd.com.br/tryd.php $\endgroup$ Commented Sep 15, 2011 at 10:33
-1
$\begingroup$

You may want to take a look at this:

https://www.youtube.com/watch?v=4CnowC3UH4s

$\endgroup$
2
  • $\begingroup$ This is not an appropriate answer $\endgroup$
    – Tomas
    Commented Aug 25, 2018 at 13:10
  • $\begingroup$ maybe expand on that video and how to use python for this $\endgroup$
    – not2qubit
    Commented Apr 17, 2021 at 23:46

Your Answer

By clicking “Post Your Answer”, you agree to our terms of service and acknowledge you have read our privacy policy.

Not the answer you're looking for? Browse other questions tagged or ask your own question.