I am quoting from "Tools for Computational Finance, 5th Edition" [Seydel].
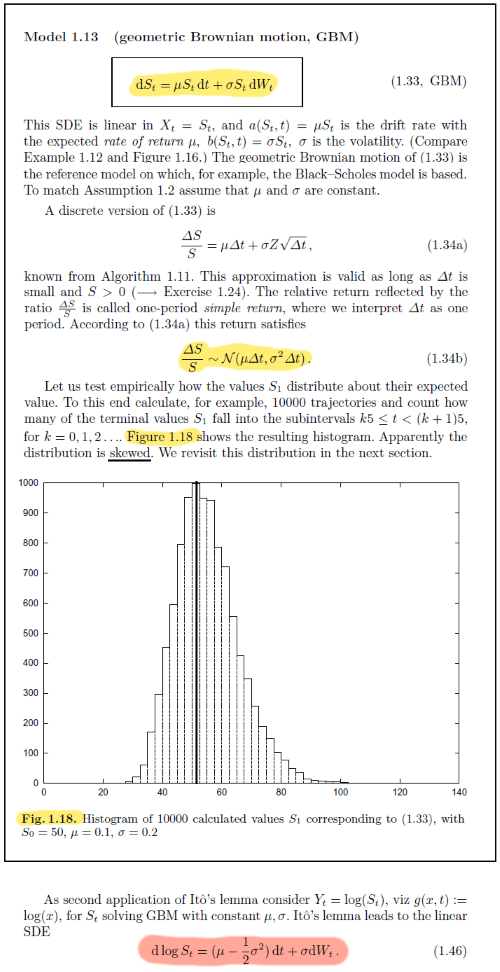
I wonder whether the histogram of simulations of the first (yellow) SDE makes sense... especially given that Seydel (correctly) states that the resulting percentage changes are normally distributed (i.e. can go below -100%).
Shouldn't the histogram much rather correspond to asset prices simulated from the second (red) SDE, as the second SDE would produce log-prices which are normally distributed, i.e. prices which are log-normally distributed?
The related question How to simulate stock prices with a Geometric Brownian Motion? does not quite cover this.

