5
$\begingroup$

I apologize if this is way too basic a question, but I'm an absolute beginner to trading and am in the process of learning the fundamentals.

Currently I'm trying to model a (10-day) SMA backtest in Excel, where signals are generated due to crossovers between the closing prices and the 10-day SMA. I calculate the daily and cumulative returns based on closing prices for the asset, and then get the daily returns of the strategy by multiplying the daily asset returns by 1 (if long) or -1 (if short) (this method of getting strategy daily returns has been suggested in a couple of blogs that I'd referred to previously).

Finally I calculate the cumulative returns for the strategy. The problem is that the cumulative returns grow insanely large (I guess up to the order of $10^{15}$). I can't understand what I'm doing wrong - whether the formulae to compute returns are wrong or if the logic itself is incorrect.

I would be grateful if someone could check out the excel sheet (google drive link below) and let me know or at least give me a hint of where I'm making a mistake (or mistakes).

Link to excel file

$\endgroup$

3 Answers 3

2
$\begingroup$

The moving average is determined as of the close of a particular day. Then to calculate the P&L you have to multiply today's state (1 or -1) by TOMORROWs return, instead you are using todays! So for example the formula in H13 needs to be E14/E13-1 and not as you incorrectly have it E13/E12-1.

HTH

$\endgroup$
2
  • 1
    $\begingroup$ Thanks! But the cumulative return for the strategy is still extremely large. I did get a vague idea from your answer that maybe the signals need to be generated a day after the crossover occurs. Once I implemented that, I got acceptable cumulative returns. $\endgroup$ Commented Apr 17, 2016 at 21:06
  • $\begingroup$ Hi, how high was your cumulative return? $\endgroup$
    – SDReyes
    Commented Aug 15, 2016 at 23:58
1
$\begingroup$

The logic behind cumulative P&L is pure scholar's. Follow it and you loss everything. Take spreadsheet and simulate reality of every day trade step by step (strongly recommend include fees) and find out difference! There is a lot of examples, a lot of discussions based on this "unverified?" assumption. Use your mind and check what it is written on Internet.

$\endgroup$
2
  • $\begingroup$ To implement a trading rule rule in real time for a while as you suggest (without using any money) is a good idea (so called "paper trading"), you can learn things that the backtest would perhaps not show. $\endgroup$
    – Alex C
    Commented Sep 19, 2016 at 22:26
  • $\begingroup$ You mean to say continuous forward testing? That's definitely a good tip. $\endgroup$ Commented Sep 22, 2016 at 12:55
1
$\begingroup$

Some years ago, I've calculated a 29-day SMA backtesting in Excel with consideration that buying and selling is not able at the same close day where the signal is generated.

Don't forget the transaction costs!

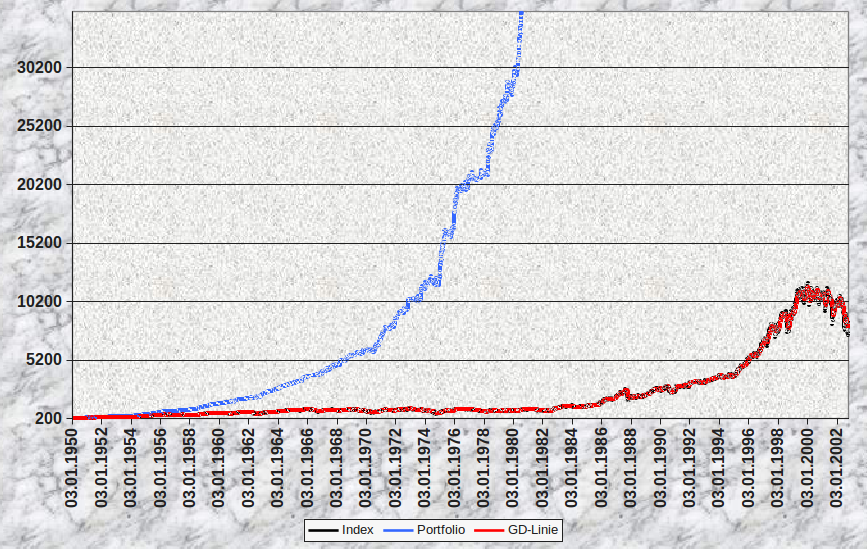
When transaction costs would be 0% (...or not included) the performance would look like this: Performance without transaction costs

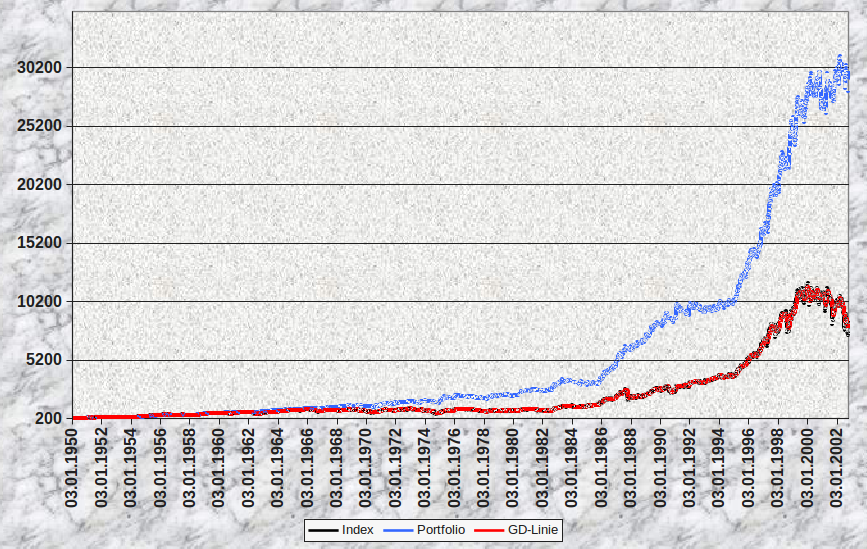
When transaction costs would be 0.45% the performance would look like this: enter image description here

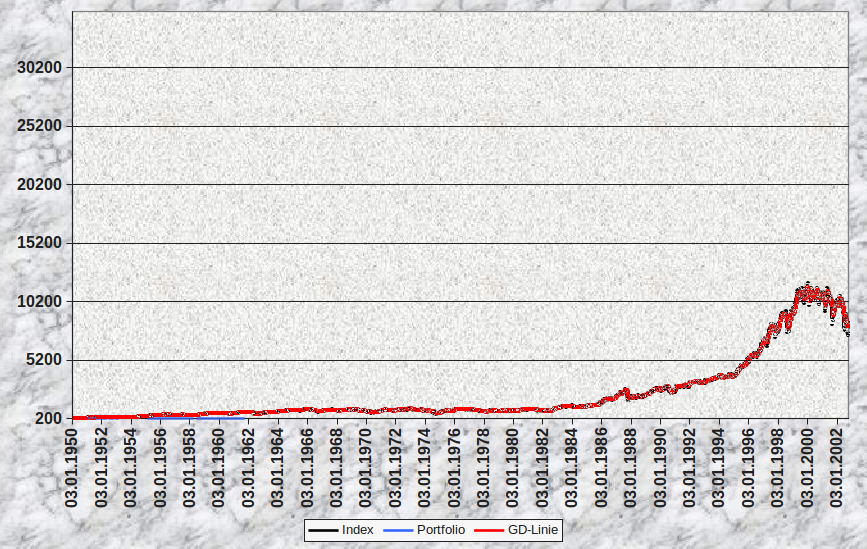
When transaction costs would be 1%, the strategy would go bankrupt just some years after launching (do you see the blue line at the bottom?): enter image description here

$\endgroup$

Your Answer

By clicking “Post Your Answer”, you agree to our terms of service and acknowledge you have read our privacy policy.

Not the answer you're looking for? Browse other questions tagged or ask your own question.