3
$\begingroup$

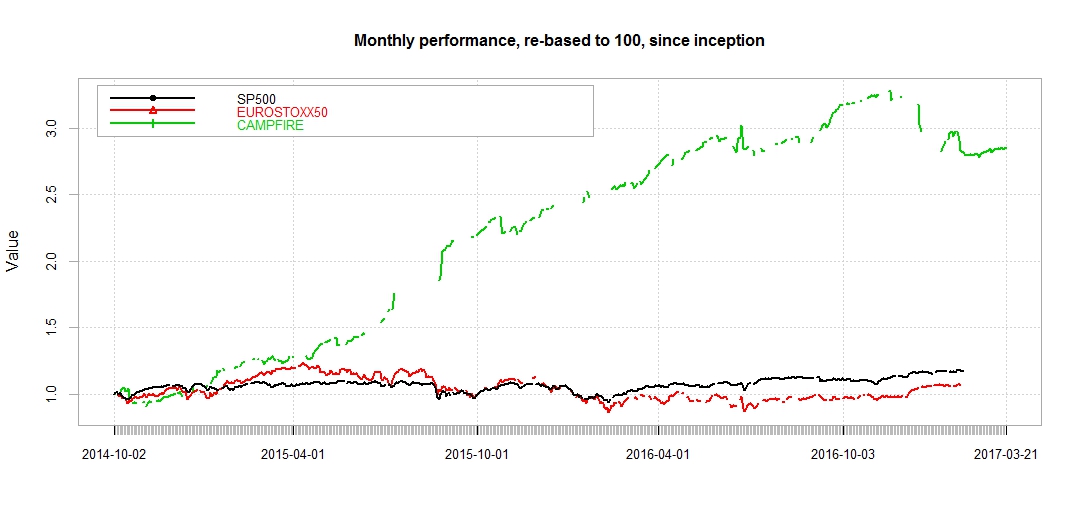
In R, with Performance analytics package, I am trying to chart multiple cumulative asset returns from an XTS object. The thing is that I miss some data from some asset returns so that the graph given from:

chart.CumReturns(XTS_DR_ALL[, c(1,2,5)], wealth.index = TRUE, main = "Monthly performance, re-based to 100, since inception", legend.loc="topleft", )

...plots non-continuous curves, which are not easy to visualize...

enter image description here

Can I do something to plot continuous lines for the asset returns of which I miss data? Best, Joe.

$\endgroup$
4
  • 1
    $\begingroup$ Could you provide a minimal, self-contained example which shows the problem? $\endgroup$
    – msitt
    Commented Apr 12, 2017 at 22:54
  • 2
    $\begingroup$ Sorry about that, please refer to the edited question beneath. $\endgroup$
    – JoeBadAss
    Commented Apr 13, 2017 at 6:46
  • $\begingroup$ Not directly related, but do you know why the data is missing? And what is missing? Prices/returns.. ? Knowing why/what would make it easier to fill the gaps. $\endgroup$
    – rbm
    Commented Apr 13, 2017 at 8:50
  • $\begingroup$ @rmb It's just non trading days for some indices Vs other indices or Vs the fund. $\endgroup$
    – JoeBadAss
    Commented Apr 13, 2017 at 17:12

1 Answer 1

3
$\begingroup$

I think your question draws on a larger issue: How to compare the performance of financial time series with missing data? The situation is indeed quite common that you have missing values for certain products (for a number of reasons) so you need a general strategy for that.

A few observations:

  1. The chart is as it is for a reason: There are missing returns in the series and just pretending as if there weren't any isn't going to help. So the chart is correct and it is also best practice not to provide some argument like impute = TRUE to make up some interpolated returns. If you wanted to do that you should do it in the underlying data, not the charting function.
  2. If your goal is to compare the performance of two products one way to go is omitting the missing values... but be careful: Don't omit the returns, omit the prices! Why? Because if you lose some prices the returns in between will still be correct, not so for losing returns!
  3. So what you want to do is first merge the two price series to get the dates where you have complete data (in database lingo a "full outer join") and after that convert them into returns.

In R you can e.g. do the following:
ROC(merge(Prices_1, Prices_2, all = FALSE))

If you want to use more sophisticated methods (with all the caveats) there is an R package especially for imputation of missing values in times series data (but I haven't tried it yet):
imputeTS: Time Series Missing Value Imputation

You can find an introductory vignette here:
imputeTS: Time Series Missing Value Imputation in R

$\endgroup$
5
  • $\begingroup$ Tks for your answer. The thing is I can't use only the dates for which I have complete data for it wouldn't be relevant in that particular case.. I really just want to smooth the visual on the graph. $\endgroup$
    – JoeBadAss
    Commented Apr 13, 2017 at 17:26
  • $\begingroup$ Ok, I understand. So how about the second part of my answer about the imputeTS package? Is this helpful? $\endgroup$
    – vonjd
    Commented Apr 13, 2017 at 20:56
  • $\begingroup$ all the imputeTs options really change the whole aspect of the graph unfortunately.. $\endgroup$
    – JoeBadAss
    Commented Apr 29, 2017 at 16:43
  • $\begingroup$ @JoeBadAss: So this is what I said: You either leave them out or you try to impute them but you cannot magically bring the true values into existence. I really don't know what you are looking for. I think I gave the best possible answer and I would appreciate if you could accept it. Thank you $\endgroup$
    – vonjd
    Commented Apr 30, 2017 at 9:47
  • 1
    $\begingroup$ yes thank you for your help and the impute package was interesting anyway :) $\endgroup$
    – JoeBadAss
    Commented May 3, 2017 at 12:52

Your Answer

By clicking “Post Your Answer”, you agree to our terms of service and acknowledge you have read our privacy policy.

Not the answer you're looking for? Browse other questions tagged or ask your own question.