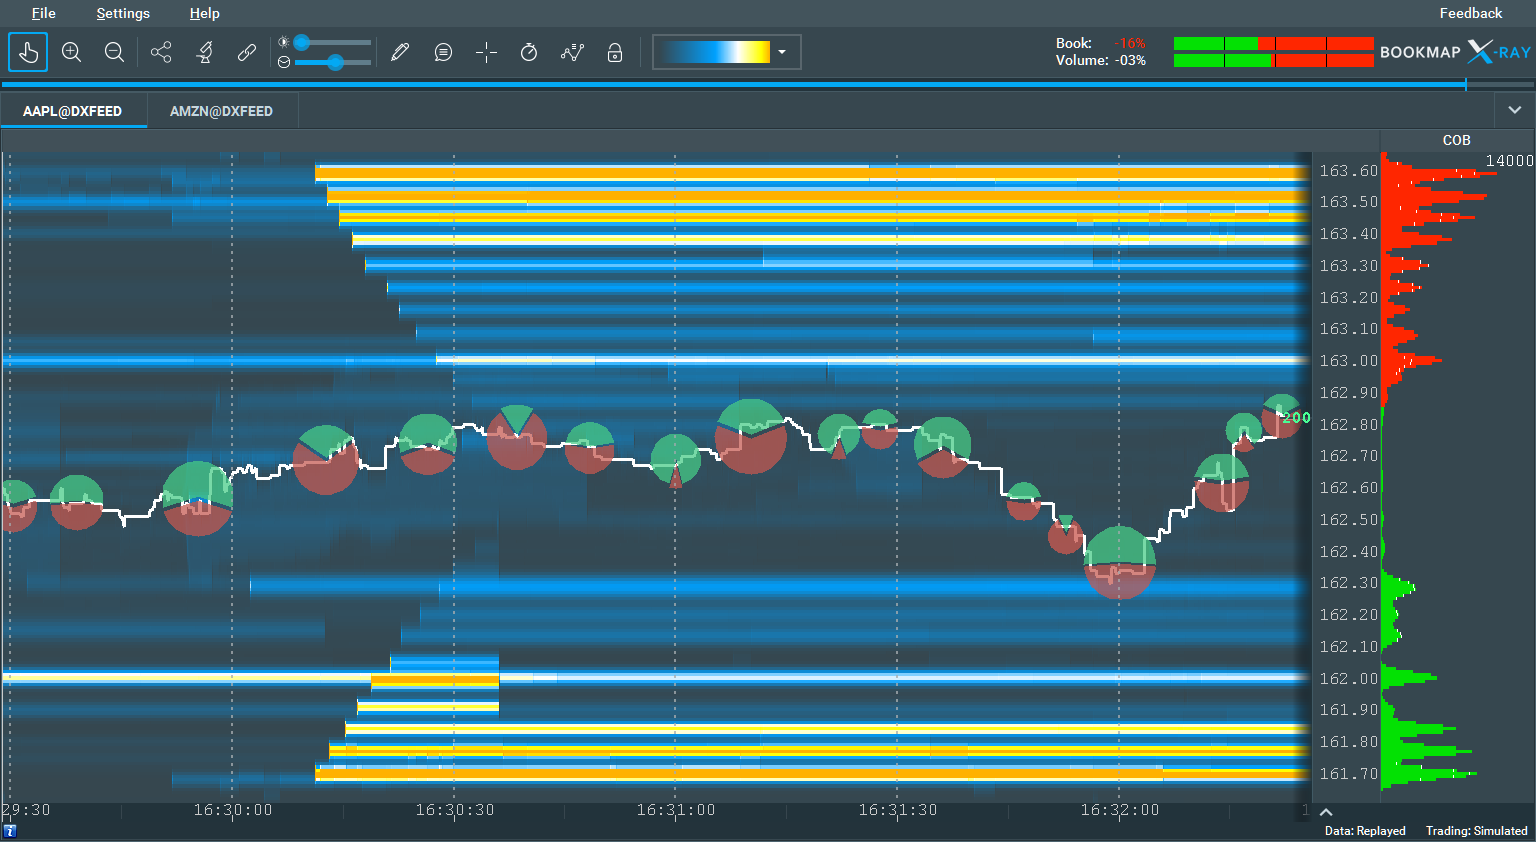
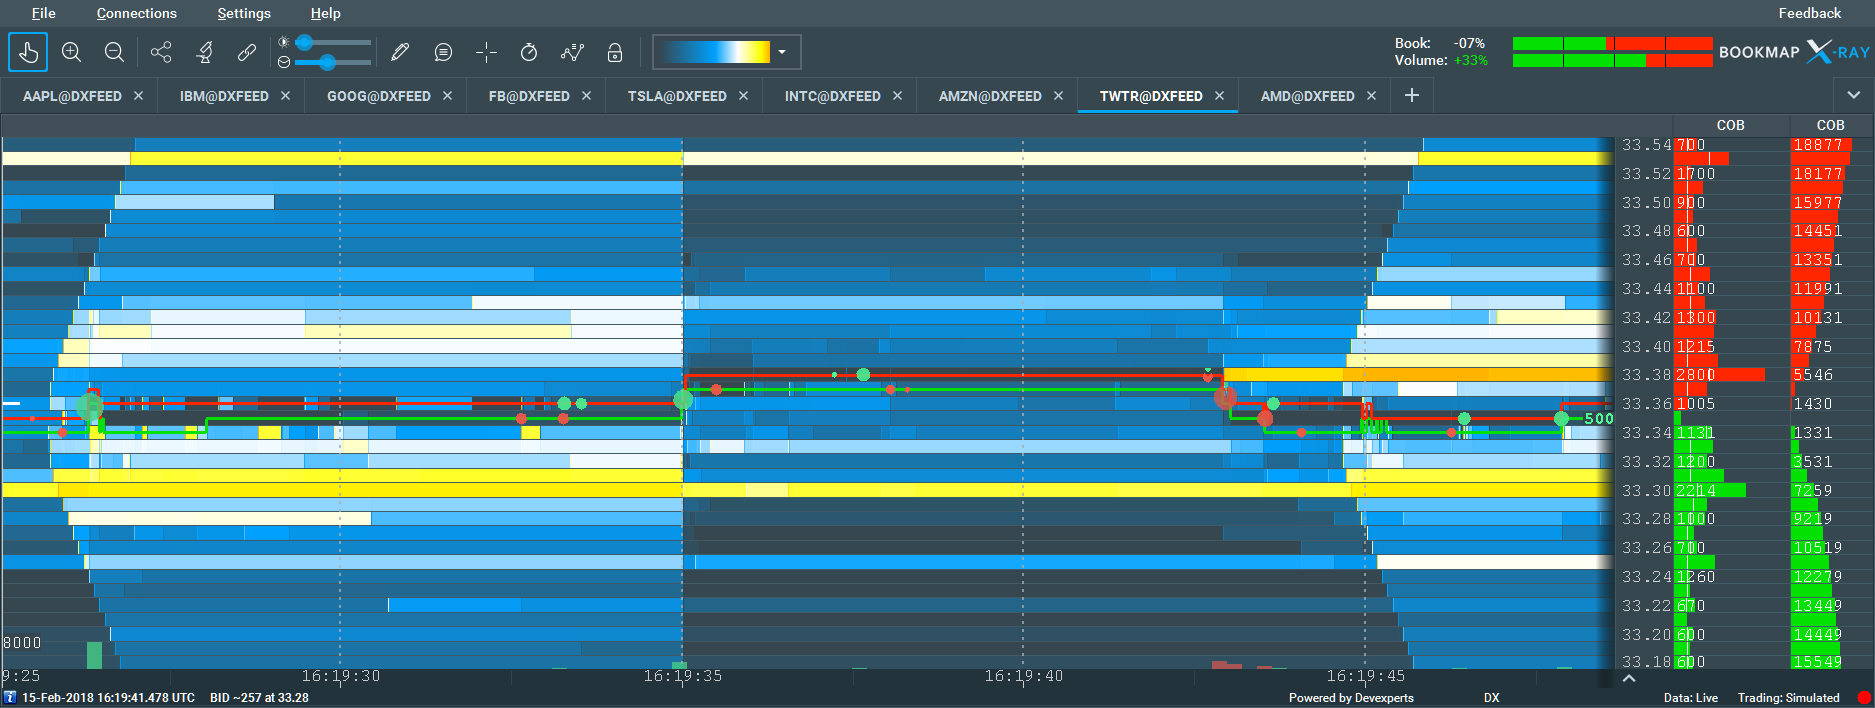
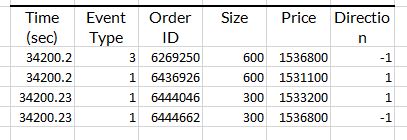
You can get streaming data of Nasdaq TotalView. Note that it contains full market depth, similar to your second image, not just N first levels as on your first image.
Check Bookmap. It's a data visualization and trading platform. It receives Nasdaq data directly through dxFeed / Devexperts. Currently you can only view it and trade. But soon it will be possible to get real-time "non-display" data through API and also historical data.
I work at Bookmap, but I'm truly not aware of any other data vendor that provides that quality of market depth data for a price, which is lower than most of low quality retail data vendors of level 1 data only. In fact, we did this research before connecting to dxFeed. Here are few visual examples.
The green and red lines are Best Bid and Best Ask accordingly. White line on the first image is last price. Green and red dots are Volume Dots, illustrating executions of Buy and Sell orders accordingly. And the Heatmap represents the market depth - see its colormap on the toolbar.
Edit: "non-display" data isn't actually available with a regular data subscription. It would cost several thousands USD per month.


