0
$\begingroup$

I would like to normalise options, to being able to compare it. Make price of underlying symbol = 1, have same tenors, and same step for the strike price.

1) Use 1 as stock_price and scale strike_price accordingly, easy to do.

2) Use same step for strike prices. Different options have different step for strike prices, for one option step could be 10% (so strike prices for CALL will be 110%, 120% etc), for another option step could be 15% (strike prices will be 115%, 130%, etc). I would like to re-scale it and use same step for all options. The problem - you need interpolate strike_prices to get those normalised values.

3) Normalise expiry date or tenors. Again different options have different expiration dates, I would like to normalise it to say 1month, 6month, 1year. Again strike_prices needs to be somehow interpolated to get those values. Any good approach to interpolate strike_prices over dates?

Are there any conventional, standard methods to do that? What functions to use for interpolation - polynomial, exponential? How to fit it, with regression?

$\endgroup$
2
  • $\begingroup$ Could you define what you mean by normalise options? Do you mean have a way to compare them accross strikes and tenors? $\endgroup$
    – raptor22
    Commented May 11, 2020 at 11:38
  • $\begingroup$ @raptor22 yes, to being able to compare options in calculations. And for myself too - as I constantly mentally in my head trying to convert absolute numbers into relative when I look at the option. $\endgroup$
    – Alex Craft
    Commented May 11, 2020 at 15:23

1 Answer 1

4
$\begingroup$

Given a certain market environment, option quotes are impacted by at least the following factors: moneyness (distance from spot/forward to strike) and tenor (time to maturity). This makes it difficult to compare option quotes accross strikes and tenors and certainly makes it impossible to compare the price of options accross different underlying stocks.

For these reasons, the options price are often quoted in terms of (Black-Scholes) implied volatilities. I will not provide a formal mathematical definition of the Black-Scholes model (which you can easily find online/in classical financial mathematics textbooks) but will rather focus on the intuition and practical approach. Here is the general idea:

  • To simplify things, I will denote $BS(k, T, S, r, \sigma)$ for the Black-Schole (BS) formula. It is a function of $k$ the strike price, $T$ the option's tenor, $S$ the underlying spot sprice, $r$ the interest rate and $\sigma$ the implied volatility.
  • For a fixed option quote $Q$ with maturity $T$ and strike $k$, given the current spot price $S$ and interest rate $r$, there is a unique implied volatility parameter $\sigma := \sigma(k, T, S, r)$ that solves for $BS(k, T, S, r, \sigma) = Q$. This is because the BS formula is an increasing and convex function in $\sigma$.
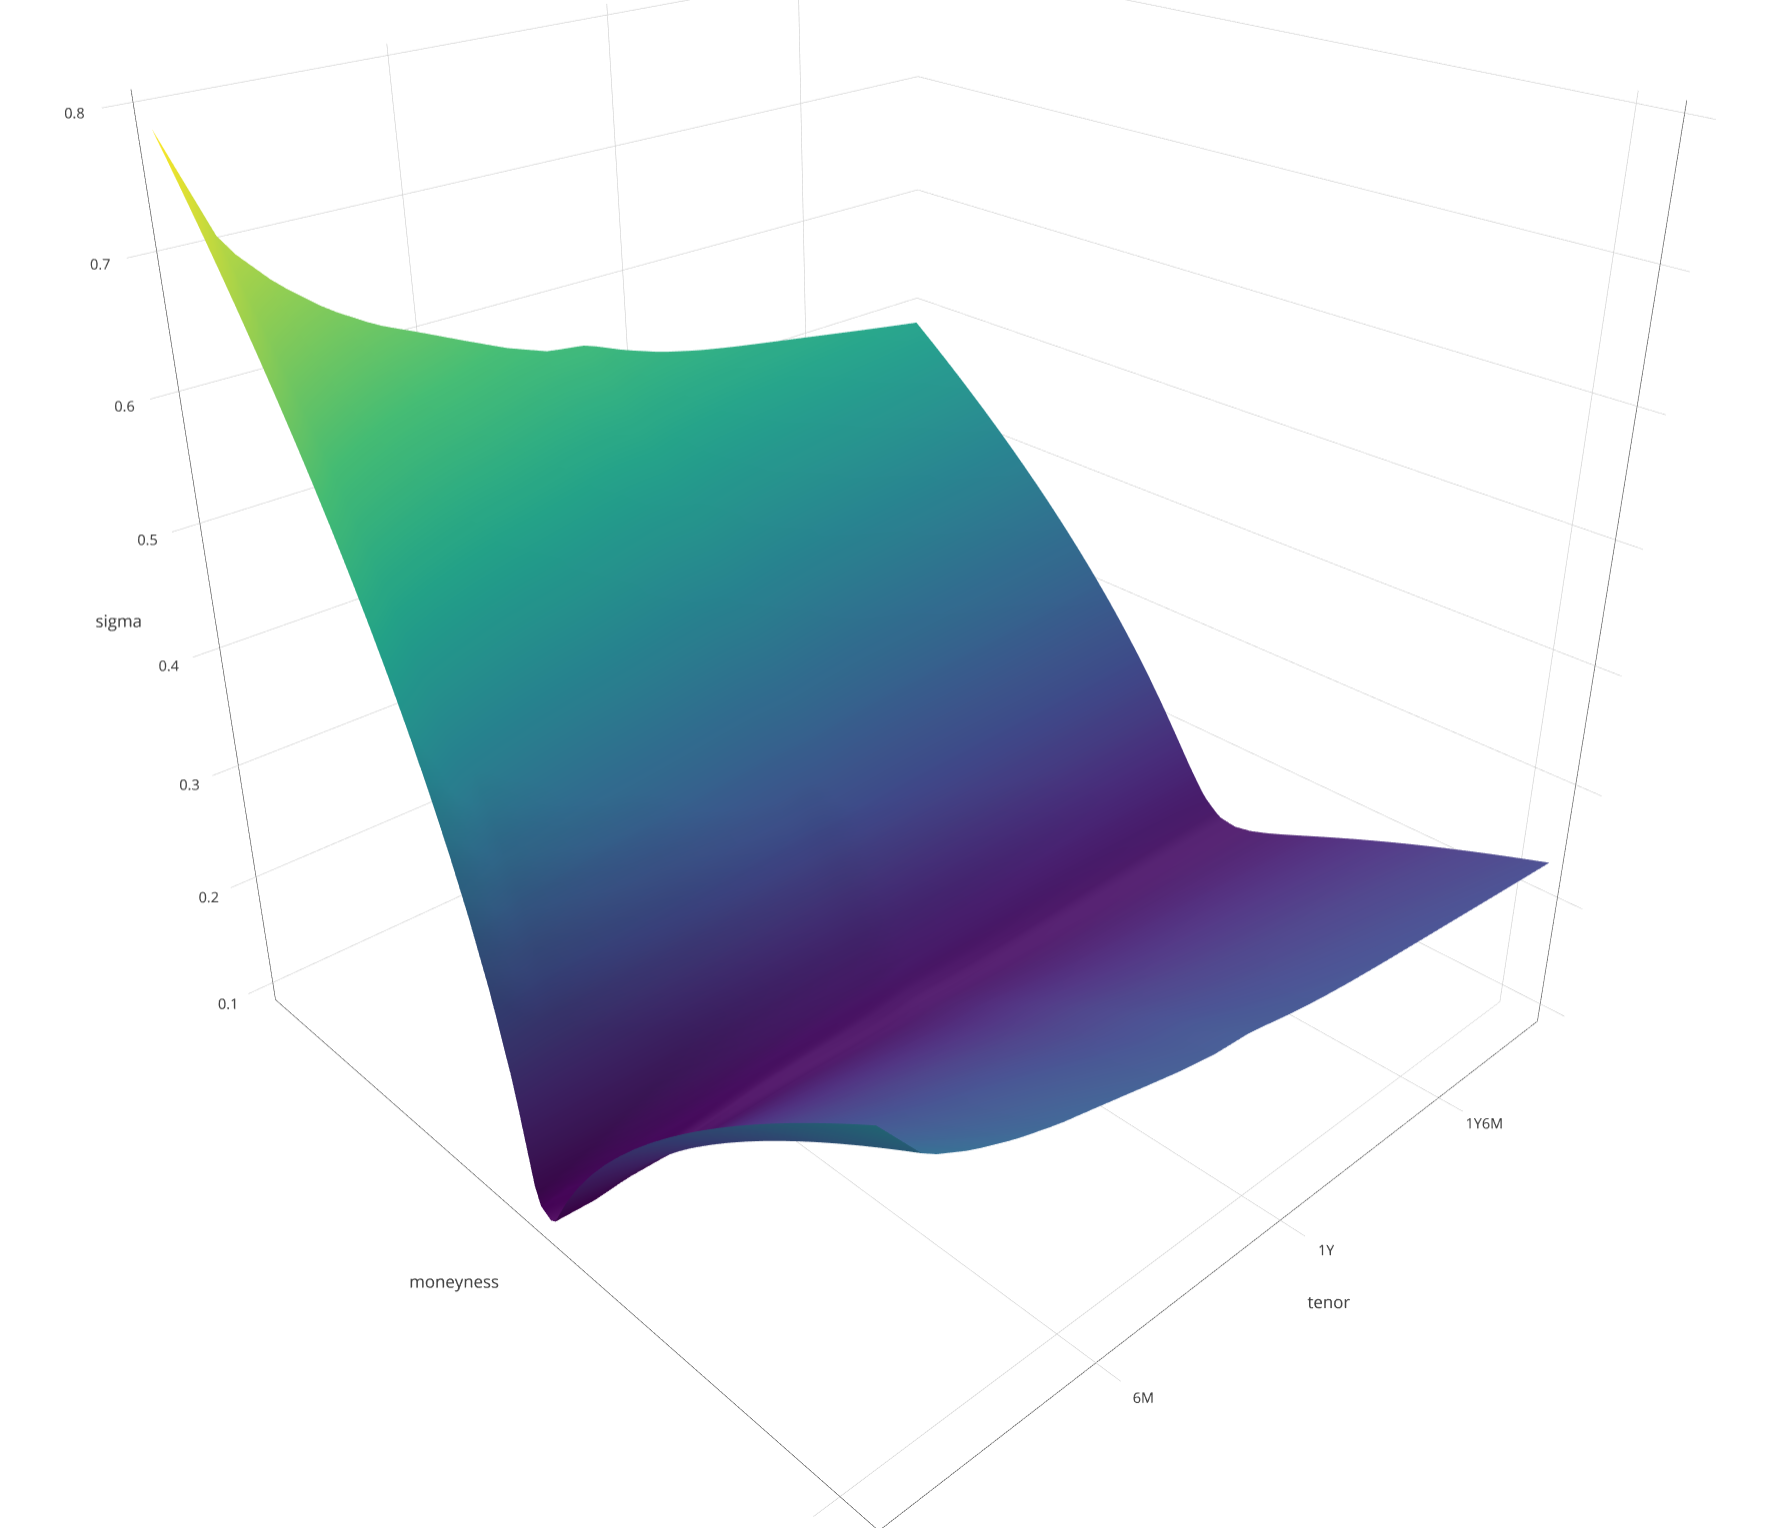
  • Due to this, at each time, we can parametrize a set of option quotes $(Q_{k,T})$ by their BS-implied volatilities $(\sigma_{k,T})$, resulting in the implied volatility surface. Here is an exemple of such a surface that I produced for S&P500 index options a while ago:

enter image description here

In particular, the surface allows us to:

  • Compare accross underlying: the BS formula uses the log forward moneyness as a measure of moneyness => independence from the specific level of the spot.
  • Compare accross tenors: the BS formula has an increasing value in the tenor. Allowing to capture the option's time value.
  • Compare accross strikes: as the option gets closer to ATM, the price increases.

Informal intuition: in general, this "normalized" parameter $\sigma$ is used to compare options prices: the higher the implied volatility, the higher the price of optionality. In this sense, the implied volatility can be seen as the market's implied "forward looking" level of uncertainty (volatility).

From a formal perspective, you cannot get it wrong by only seeing it as a parametrization of the quotes without asking yourself about it's validity as a model.

Regarding the interpolation/extrapolation, you can see Extrapolating option pricing with different expirations

Let me know if you want me to elaborate more on something.

$\endgroup$
3
  • $\begingroup$ Thank you for such a detailed answer. I'm wary about Black Scholes (but I'm novice and maybe wrong) because: 1) It assumes Normal Distribution, while famous B. Mandelbrot said stock price has Pareto Distribution users.math.yale.edu/~bbm3/web_pdfs/mildvswild.pdf 2) It relies on past volatility - and I don't use past stock prices in my calculations and use fundamentals instead 3) Past stock prices can't predict unforeseen interventions like Coronavirus or Fed QE. $\endgroup$
    – Alex Craft
    Commented May 12, 2020 at 19:43
  • 2
    $\begingroup$ Your question is specifically about having comparable parameters accross strikes and tenors, which is what BS parametrization provides you with. Regardless of the model behind, you can see it in the same way as any other parametric model that depends on parameters. Using the IVs to compare in this way does not relate to any underlying assumption. $\endgroup$
    – raptor22
    Commented May 12, 2020 at 21:39
  • 3
    $\begingroup$ Also, the BS implied volatility does not rely on historical data, but on forward looking market implied distribution. The reason why the volatility surface is not flat across strikes and tenor is exactly because the market is not assuming normal distribution with single volatility prameter accross strikes and tenor, hence the skew. $\endgroup$
    – raptor22
    Commented May 12, 2020 at 21:41

Your Answer

By clicking “Post Your Answer”, you agree to our terms of service and acknowledge you have read our privacy policy.

Not the answer you're looking for? Browse other questions tagged or ask your own question.