1
$\begingroup$

I am trying to forecast the volatility using GARCH modelling in R.

I fit an ARMA(1,1)-GARCH(1,1) model, but my sigma predictions are constantly decreasing. Anybody know why?

predict(garch1,n.ahead=63)
    meanForecast  meanError standardDeviation
1  -0.0005595252 0.02732987        0.02732987
2   0.0014640502 0.02736439        0.02732390
3   0.0001896293 0.02737454        0.02731802
4   0.0009922427 0.02737510        0.02731222
5   0.0004867674 0.02737190        0.02730651
6   0.0008051090 0.02736726        0.02730088
7   0.0006046217 0.02736210        0.02729534
8   0.0007308860 0.02735678        0.02728988
9   0.0006513664 0.02735145        0.02728450
10  0.0007014468 0.02734615        0.02727919
11  0.0006699068 0.02734093        0.02727397
12  0.0006897703 0.02733577        0.02726882
13  0.0006772605 0.02733069        0.02726375
14  0.0006851390 0.02732568        0.02725875
15  0.0006801772 0.02732074        0.02725383
16  0.0006833021 0.02731588        0.02724898
$\endgroup$
8
  • $\begingroup$ perhaps what you are looking at is the forecast for the underlying series and not the vol? $\endgroup$
    – user25064
    Commented Jun 5, 2015 at 18:08
  • $\begingroup$ I dont think so because also when I use egarch or gjrgarch: ugarchforecast(gjrGARCH1, data =brentlog1, n.ahead = 21), then I get decreasing sigma and thats the volatility $\endgroup$ Commented Jun 5, 2015 at 18:10
  • $\begingroup$ The meanforecast is the forecast of the series but the standard deviation is forecast of volatility no? $\endgroup$ Commented Jun 5, 2015 at 18:10
  • $\begingroup$ it would be probably insightful to grab the estimated parameters and write out the equations to see what the forecast is using for the underlying model $\endgroup$
    – user25064
    Commented Jun 5, 2015 at 18:14
  • $\begingroup$ Yes. But anyway my data is the log daily returns so what is the best way to calculate the realised vol? I only have the daily average return $\endgroup$ Commented Jun 5, 2015 at 18:15

1 Answer 1

1
$\begingroup$

Garch models are not good to predict "many" periods ahead, but for "very short" times.

If you want to predict 2 months from here, maybe you should be working with monthly data.

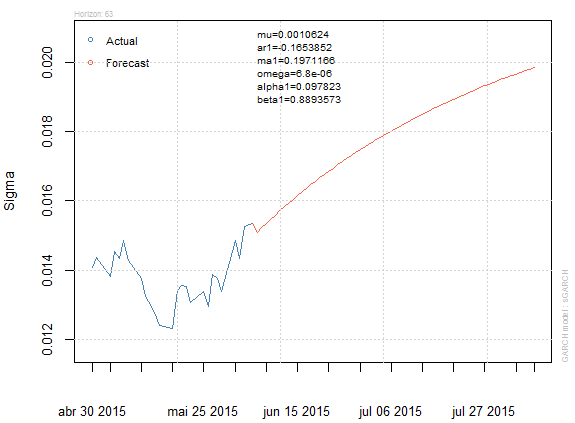
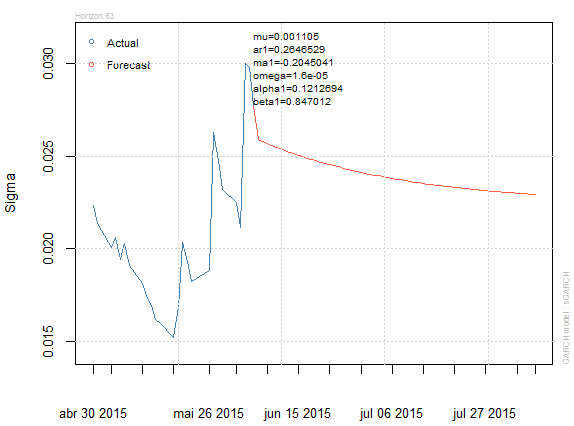
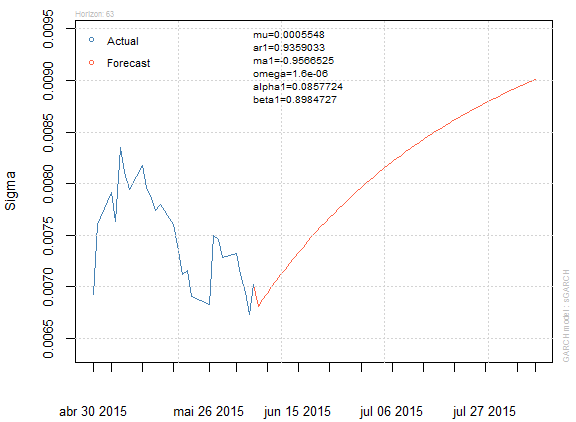
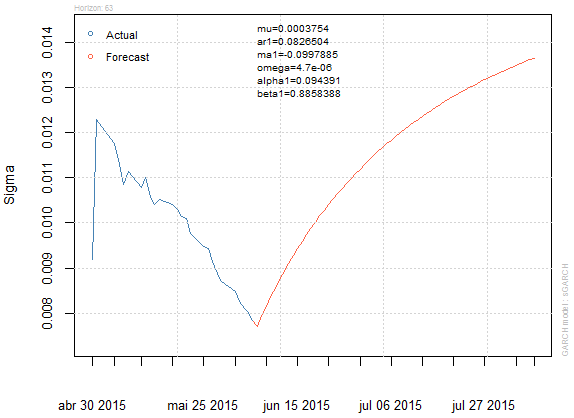
I did a similar exercise with some indexes (symb=c("^BVSP","^MERV","^DJA","^N225")) using daily returns from="1991/01/01", look the incredible predictions.

enter image description here enter image description here enter image description here enter image description here

$\endgroup$
1
  • 1
    $\begingroup$ Thanks. I found GARCH actually to be good to predict volatility but bad to predict returns. $\endgroup$ Commented Jun 6, 2015 at 12:53

Your Answer

By clicking “Post Your Answer”, you agree to our terms of service and acknowledge you have read our privacy policy.

Not the answer you're looking for? Browse other questions tagged or ask your own question.