I would like to model an index e.g. FTSE 100. I have a list of all companies that make up the index and their stock values (daily high, low, volume, close values). In total, this time series data has 400+ features.
I would like to build a neural network similar to this one, but first I ran a Pearson correlation and found that there is high correlation between stocks.
I want to predict the value of the FTSE 100.
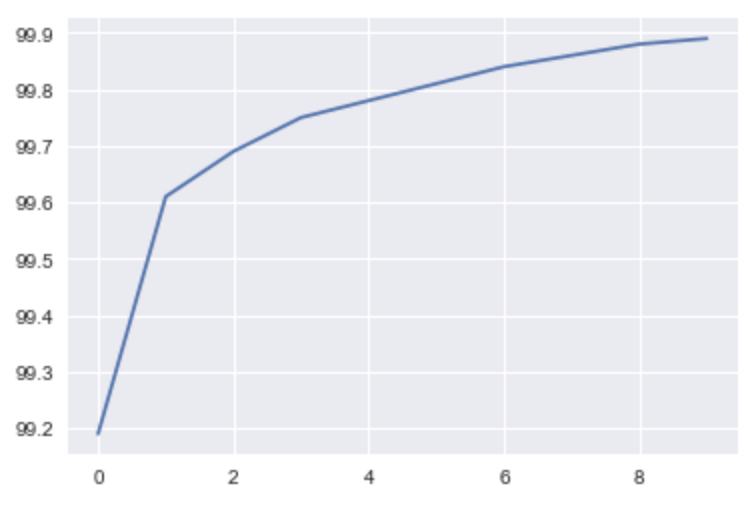
First of all, I scaled the data and then applied PCA to remove correlations and found that 0 components account for 99% of variability. Now my columns look like the following:
Date         FTSEOpen FTSEClose Stock1Open Stock1Close Stock2Open Stock2Close
01/01/2006   2880     2890      144        130         300        333
...
08/01/2018   3862     3851      204        311         134        154
I did PCA on all columns, and got the following result (which doesn't make sense!)
I am currently thinking of adding extra features such as 5day gradients etc. to mix things up.
Also, I'm not sure what Y_TEST is. I understand this is next days data, but I'm still trying to understand what the network input is. If I use all past data, the input dimensions keep increasing with every day.
Let's say I computed PCA, now I have just 1 vector...(1 date column and 1 PCA vector), this now looks like very little data to actually predict stock prices.

