I have been reading Advances in Financial Machine Learning by Marcos López de Prado and came across different Bar types, and simulating Volume Bars from execution data myself.
My understanding of Volume Bars is that they are based on a given number of shares traded (volume). Each bar represents trades whose total volume is equal to the volume threshold. A new bar is created when the total volume of the current bar reaches the threshold.
But the output of existing libraries[*1] based on the said book contradicts my understanding. What am I missing here?
To be more specific...
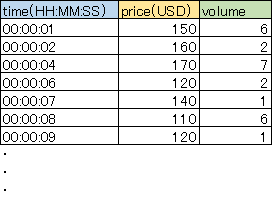
... Suppose we have below raw trade data, and set the threshold to 5.
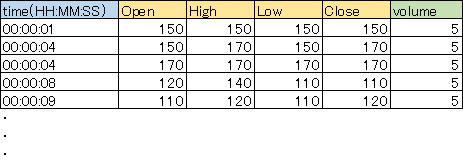
I expect the Volume Bars to be like the following ...
The libraries return the Volume Bars like this...
[*1]
mlfinlab by Hudson and Thames
Adv_Fin_ML_Exercises by BlackArbsCEO


