Goal:
I'm looking to see if it's possible to programatically detect "measured moves" on candlestick data. The price data I am using is successfully retrieved from the TD Ameritrade platform using the unofficial Python API.
Details:
For an "upwards measured move", this is where the price reaches both higher lows and higher highs on a candlestick chart. For a "downwards measured move", the price reaches both lower highs and lower lows.
A very simplified image of the measured move trendline shape I'm looking to programmatically detect can be seen below:
(Left) Upwards Measured Move, and (Right) Downwards Measured Move:
As can be seen from the "upwards measured move", the price moves up from points A to B. After B, the price falls to point C (which this time is a "higher low" than A). Finally, the price moves to point D, on its way passing the price level of point B. The exact opposite can be said for "downwards measured moves".
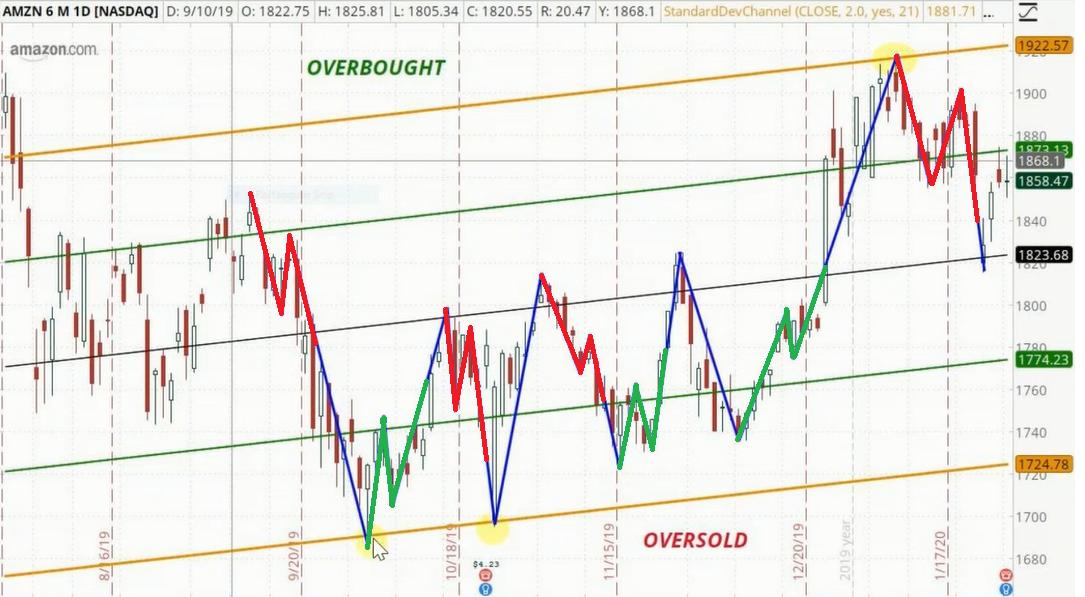
An example of both upwards (green) and downwards (red) measured moves can be seen below on an Amazon chart using drawn trendlines (please ignore the 5 horizontal(ish) regression lines):
Questions:
Q1. Is there a Python library that can detect these measured move?
Q2. If there is no library that can exclusively detect measured moves, could a library such as trendet (which detects trends in price data) be used in the following context:
- If a downtrend is detected, which is
- Followed by an uptrend that doesn't reach as high of a price level, which is
- Finally followed by another downtrend where the price falls lower than the point B level,
then a downward measured move has been detected, for example?
Q3. Again if there is no library and trendet isn't viable, could something like the following logic work? For example,
If the current price continues to fall lower than the previous X candles,
and then the price reverses and rises for X candles but doesn't reach the same level,
before finally falling again for another X candles,
then a "downwards measured move" has been detected? The issue here is the question of how many candles could be appropriate?
Q4. Could some pattern recognition to detect a triangular shape work? I guess another issue with this would stem from the fact that most of the triangles are rarely the same shame (which is evident in the second image).
If anyone has any knowledge they wouldn't mind sharing, or could point me in a direction where I can learn about some resources to help in detecting measured moves, I would really appreciate it.


