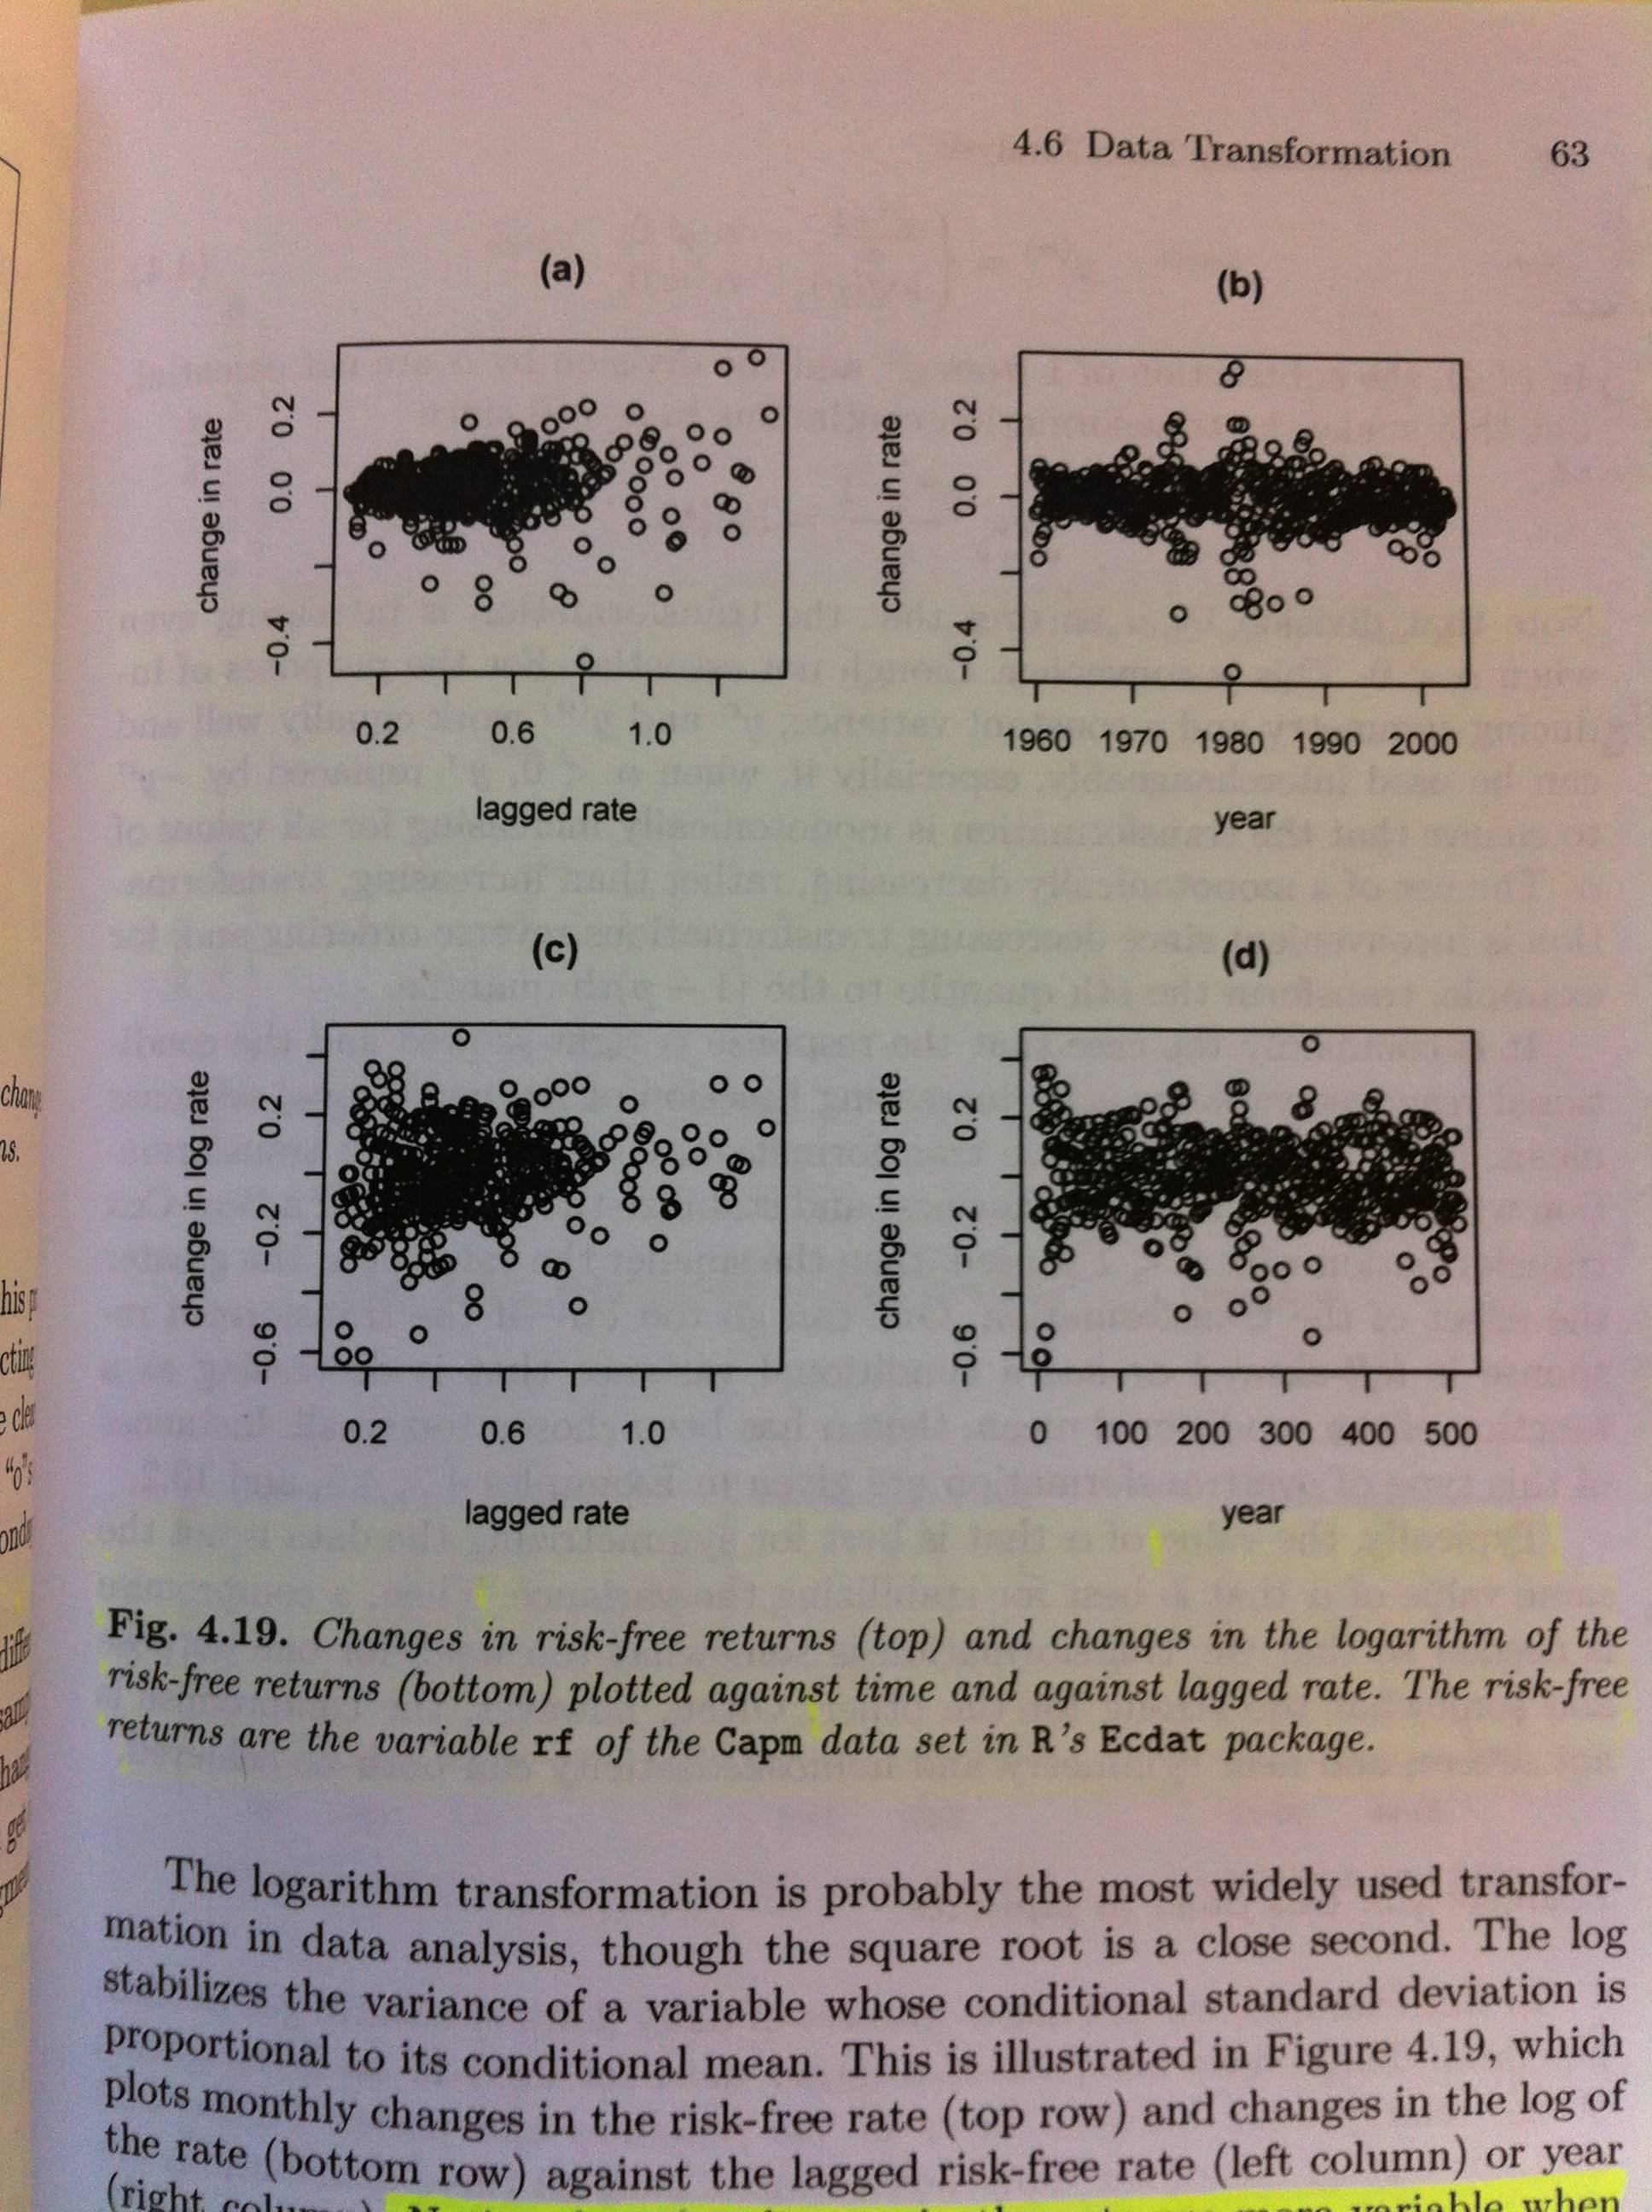
I am trying to reproduce a plot in "Statistics and Data engineering for Financial Engineering" by D. Ruppert. The author uses the risk free returns data available in the Ecdat package in R. Specifically the rf variable in the Capm data set of this package. He wants to demonstrate that changes in the rate are more variable for large values of the rate (heteroskedacity). So in figure 4.19 (a) he plots the change in the rate vs the lagged rate, and indeed for larger values the points in the scatter plot are more dispersed. I want to reproduce this plot. But I have no idea what the "lagged rate" here means. Any ideas?
I have attached the plot below.
I would like to reconstruct figure 4.19 (a), but I'm not exactly sure what to plot on the x-axis.

