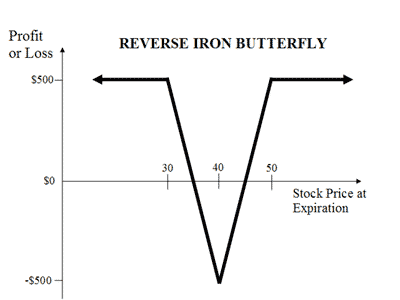
I often see questions like "Given this payoff graph (example below), construct a portfolio that replicates it." I want to know if there is an efficient method/algorithm to find the individual pieces that comprise it (long/short puts/calls/stock).

So to pose this more mathematically, given profit and loss function below where $x$ is the stock price at expiration and given that each option type has a fixed premium (not necessarily the same, but maybe an easy assumption to start with), can you efficiently recreate this from individual options?
$$ P(x)= \begin{cases} p_0(x), & x \le \beta_0 \\ p_1(x), & \beta_0 \le x \le \beta_1 \\ \qquad. \\ \qquad. \\ \qquad. \\ p_n(x), & \beta_{n-1} \le x \le \beta_n \\ \end{cases} $$
We know that each $p_i(x)$ is either constant or linear and every basic option type has a function associated with it. For example shorting one call with strike price k and premium p gives the function: $$ \begin{cases} p, & x \le k \\ -x+k+p, & x \ge k \\ \end{cases} $$
