4
$\begingroup$

enter image description here

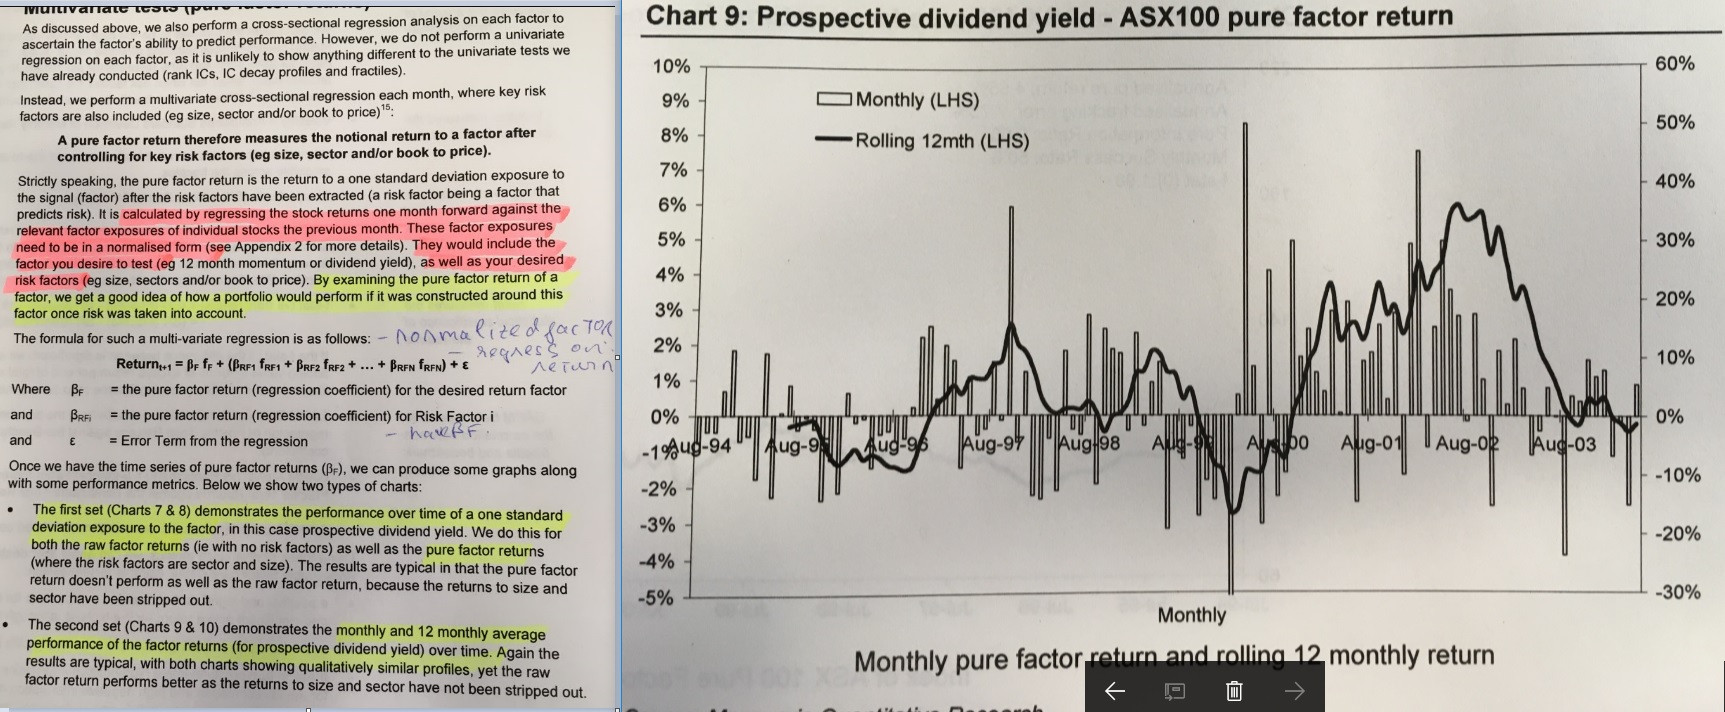
I am reading a paper. The authors use the multivariate regression to calculate the pure factor return $\beta_F$ using the following equation: $$Return_{t+1}=\beta_F f_F + \beta_{RF_1} f_{RF_1} +⋯+ \beta_{RF_N} f_{RF_N} +\epsilon$$

where

  • $\beta_F$ = pure factor return for the desired return factor,

  • $\beta_{RF_i}$ = pure factor return for Risk factor $i$,

  • $f_F$ = evaluated factors (ex: Dividend Yield)

  • $f_{RF_i}$ = risk factor (ex: size)

After that, they produce a monthly factor return as the graph here. I just wonder from the pure factor return for the desired return factor, how they can get the return over months like the graph?

$\endgroup$
2
  • $\begingroup$ May I know the paper's title? I also would like to read it. $\endgroup$ Commented Apr 26, 2023 at 2:12
  • $\begingroup$ @duoduohaitang it's a research primer by Macquarie called "The A-Z of Quant" $\endgroup$
    – oronimbus
    Commented Apr 26, 2023 at 15:49

2 Answers 2

5
$\begingroup$

From that picture you took, it looks like the $\beta_F$ is a time series. It's computed by doing a cross-sectional regression at each point in time.

$\endgroup$
1
$\begingroup$

In the cross sectional framework, the "pure factor return" is actually the return of the characteristic portfolio, which has unity exposure to the underlying factor and zero to others. If you hold the portfolio for one month, you get the monthly return.

$\endgroup$

Your Answer

By clicking “Post Your Answer”, you agree to our terms of service and acknowledge you have read our privacy policy.

Not the answer you're looking for? Browse other questions tagged or ask your own question.