7
$\begingroup$

I'm looking for short interest data (those disclosed on 15 days basis to FINRA)

Some sites like gurufocus.com (under ownership sections) contain it and I doubt they buy it from NYSE.

Do you know about feasible way to obtain this data (in CSV and free would be a dream, but I don't expect that), without scraping sites like gurufocus (some more official way like FINRA download page)

$\endgroup$
3
  • 1
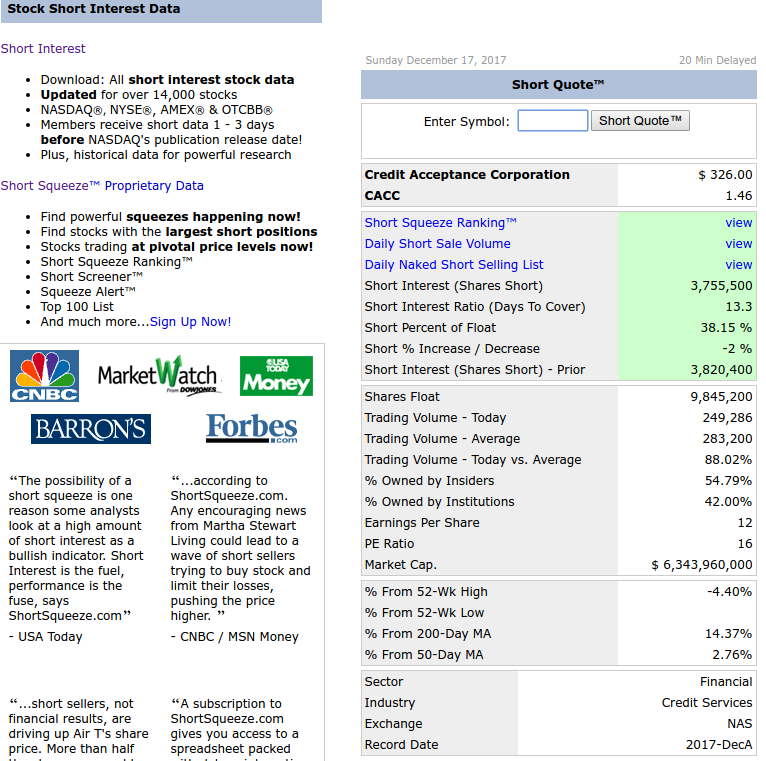
    $\begingroup$ shortsqueeze.com is decent. The monthly fee for membership is quite reasonable. $\endgroup$
    – amdopt
    Commented Sep 25, 2017 at 17:57
  • $\begingroup$ SunGard and DataExplorers were the two commercial products for this. Their historical coverage wasn't so great when I last checked years ago, but presumably is years better now. $\endgroup$
    – shabbychef
    Commented May 17, 2018 at 5:37
  • $\begingroup$ shortsqueeze.com short interest data seems to be bi-weekly, correct? $\endgroup$ Commented Feb 1, 2021 at 8:09

3 Answers 3

2
$\begingroup$

FREE

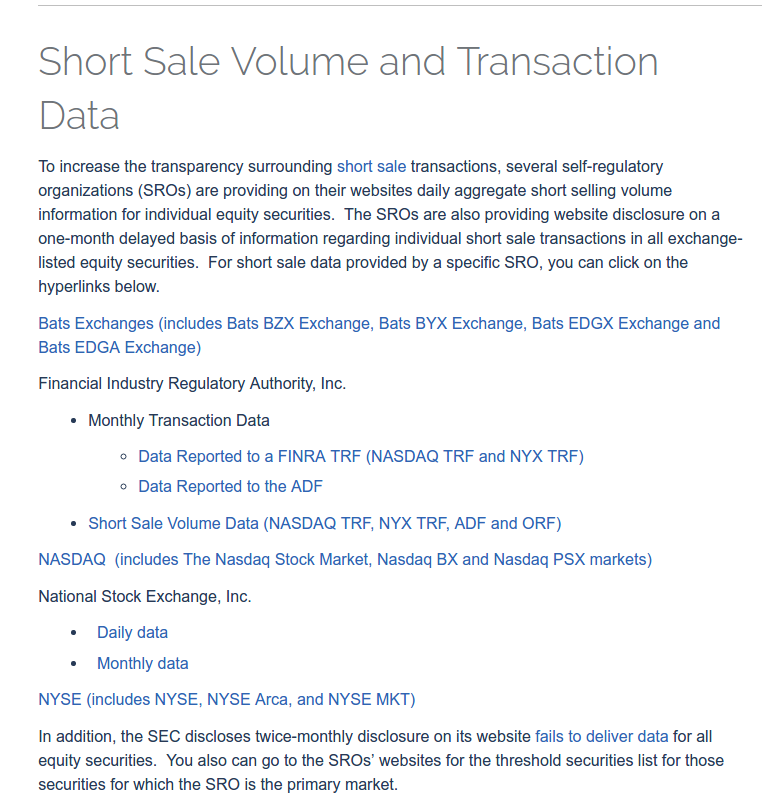
Short Sale Data Source SEC

Data Reported to a FINRA TRF (NASDAQ TRF and NYX TRF)


This is a direct link to all of the short sale data available.

Short Sale Volume Data (NASDAQ TRF, NYX TRF, ADF and ORF) Short Sale Volume and Transaction Data

PAID


Short Squeeze Short Squeeze Homepage

$\endgroup$
2
  • $\begingroup$ Why is this being upvoted? The question is specifically about short interest, not short volume. $\endgroup$ Commented Feb 27, 2021 at 14:52
  • $\begingroup$ Not sure if you can read, but just in case you cannot , the paid site lists short interest. If you have a better answer, upload, otherwise kindly read more carefully =) $\endgroup$ Commented Mar 13, 2021 at 3:49
1
$\begingroup$

The short interest data is available in WSJ, Barrons -

http://www.wsj.com/mdc/public/page/2_3062-shtnasdaq_A-listing.html

Company Symbol 8/31/18 8/15/18 Chg % Chg % Float Days to cover Avg daily volume A V Homes, Inc. AVHI 1,495,223 1,612,125 -116,902 -7.3 14.0 12 127,240

The 1,495,223 is the short interest corresponding to 8/31.

Barrons has a similar URL -

Company Symbol 8/31/18 8/15/18 Chg % Chg % Float Days to cover Avg daily volume D.R. Horton Inc. DHI 11,153,948 10,699,837 454,111 4.2 3.3 4 2,887,108 Dana Incorporated DAN 3,185,291.0 2,938,603.0 246,688 8.4 2.2 3 1,093,989 Danaher Corporation DHR 4,777,526 4,971,650 -194,124 -3.9 0.8 2 2,085,656

$\endgroup$
1
$\begingroup$

Did you ever find what you're looking for? The only other place I could find was the COMPUSTAT database accessed via WRDS. You'd need to access this database through a business library though, and probably on-site.

$\endgroup$

Your Answer

By clicking “Post Your Answer”, you agree to our terms of service and acknowledge you have read our privacy policy.

Not the answer you're looking for? Browse other questions tagged or ask your own question.