4
$\begingroup$

First and foremost, I'm trying to understand why you would construct a portfolio made up of long calls, long puts and short calls. I find this really abstract and confusing. I've tried drawing the pay-off diagram but I can't wrap my head around it. Does anyone have an intuitive explanation as to when this might be useful and under what market conditions?

I've been asked to calculate the Delta, Gamma and Delta-Gamma approximation for the PL in terms of the underlying return $R$. As usual, $S$ is the underlying asset price, $K$ is the strike price, $r$ is the risk-free rate, $\sigma$ is the volatility, $T$ is maturity and $\Phi$ is the standard normal distribution function.

Let's say the portfolio is made up of the following:

  • Long $3,000$ call options with strike $K=52$ and expiry $T=6m$ ($\Delta_1$)
  • Long $1,600$ put options with strike $K=48$ and expiry $T=3m$ ($\Delta_2$)
  • Short $4,000$ call options with strike $K=56$ and expiry $T=1y$ ($\Delta_3$)

All options have the same underlying $S$. The current asset price is $S_0=50$, $\sigma=25\%$ and $r=5\%$.

The Delta is a pretty straight-forward plug in of the numbers into:

$\Delta_{call} = \Phi(d_1)$, where $d_1=\frac{\ln\left(\frac{S}{K}\right)+(r+\sigma^2/2)T}{\sigma \sqrt{T}}$

However, this is where I get confused. The Delta of the long calls ($\Delta_1$) is just a straight-forward plug-in of the numbers. The Delta of the long puts ($\Delta_2$) is equal to $\Delta_{call}-1$ through put-call parity. What I get confused about is the $\delta$ for the short calls. In this instance, $d_1$ is negative, however, $\Phi(d_1)$ is the cdf for the standard normal so is always between $0$ and $1$, meaning the Delta is positive, and as we are short, the Delta term is negative.

In my head this is: $\Delta_{portfolio} = +\Delta_1 +\Delta_2 - \Delta_3$ (long, long, short), which leads to a negative delta for the portfolio as $\Delta_1$ is positive, $\Delta_2$ is negative and $\Delta_3$ is positive.

I get that a negative Delta is advantageous in a bearish market when the underlying is expected to go down but this particular portfolio structure has my head spinning. Once I have my head around the Delta I'm sure I can do the rest but I'm struggling to understand this even on a basic level. The different time horizons add to the confusion so any intuitive explanation around that would also be welcome.

$\endgroup$
0

2 Answers 2

3
$\begingroup$

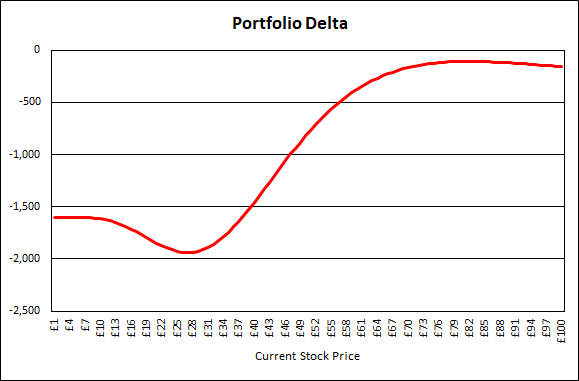
You are right with your statements. The delta formula for calls is correct and $\Delta_p=1-\Delta_c$. However, if you are short an option with delta $\Delta$, your portfolio has a delta of $-\Delta$. Thus, your portfolio has a delta of $$\Delta_{\mathrm{Portfolio}} =3000\cdot\Delta_c+1600\cdot(1-\Delta_c)-4000\cdot\Delta_c.$$ Of course, the three deltas are different since they relate to options with different strikes and maturities and are not constant but alter once the market has moved. If you plot $\Delta_{\mathrm{Portfolio}}$ for varying stock prices $S_0$, you obtain the following figure.

enter image description here

As you see, the portfolio delta is indeed always negative. As you noted, the put options have negative delta and so do short calls. Note that $\lim\limits_{T\to\infty}|\Delta|=1$. So, you asks why would anyone build such a portfolio? It is indeed a bearish portfolio which bets on dropping stock prices. but by selling call options, you gain some premium to lower your initial cost.

$\endgroup$
2
$\begingroup$

All the maths and logic above look correct to me. The moral of the story here, and the point of structuring the exercise thus, is a reminder that an option is no more or less than a bet that can be hedged with an equivalent position in the underlying. There doesn’t have to be some devilishly clever cunning plan. The positions above might eg the risk of a broker, with clients who just happen to have taken the other side. Nor do you know/state whether there’s a position in the vanilla underlying. In which case, this could represent a (too cute) covered call.

But let’s break this down.

  • what you have here is a big bet (4000 lots) that the market isn’t going up a lot in a years time.
  • But the short gamma on this is horrible, so I take out a couple of smaller insurances.
  • Buying some (only 3000] shorter-dated (6 vs 12m) reduces the risk that i’ll Look like an idiot in front of my boss next if it goes straight to 53. At 53-54, I’m just fine for the next few months.
  • there’s no scenario in which I’m not ultimately bearish. If it gets bought out at say 70 next week, I’m still net 1000 short.
  • the long put is just fine-tuning. Keeps me short, stops the risk managers worrying about my gamma so much. But it’s a tiny exposure, only 1600 lots 3m. I don’t really want to pay up too much. Maybe i’m Willing up a bit to look good to the risk boys. Maybe there is some actual short-term risk/catalyst.
  • The real point here is that there is no way the metrics on this leg can really move the needle on the aggregate, given the two much larger other positions out there. So in a very real sense, it really doesn’t matter as much.
  • at heart, all I’m really doing is selling some long-dated calls; and putting in a little “aircover”, by buying a fraction of them back on a shorter time-frame.
$\endgroup$

Your Answer

By clicking “Post Your Answer”, you agree to our terms of service and acknowledge you have read our privacy policy.

Not the answer you're looking for? Browse other questions tagged or ask your own question.