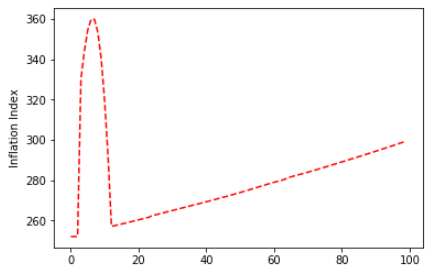
This is what I've got, but I'm getting weird results. Can you spot an error?:
zciisData = [(ql.Date(18,4,2020), 1.9948999881744385),
                 (ql.Date(18,4,2021), 1.9567999839782715),
                 (ql.Date(18,4,2022), 1.9566999673843384),
                 (ql.Date(18,4,2023), 1.9639999866485596),
                 (ql.Date(18,4,2024), 2.017400026321411),
                 (ql.Date(18,4,2025), 2.0074000358581543),
                 (ql.Date(18,4,2026), 2.0297999382019043),
                 (ql.Date(18,4,2027), 2.05430006980896),
                 (ql.Date(18,4,2028), 2.0873000621795654),
                 (ql.Date(18,4,2029), 2.1166999340057373),
                 (ql.Date(18,4,2031), 2.152100086212158),
                 (ql.Date(18,4,2034), 2.18179988861084),
                 (ql.Date(18,4,2039), 2.190999984741211),
                 (ql.Date(18,4,2044), 2.2016000747680664),
                 (ql.Date(18,4,2049), 2.193000078201294)]

def build_inflation_term_structure(calendar, evaluationDate):
    dayCounter = ql.ActualActual()
    yTS = build_yield_curve()

    lag = 3

    fixing_date = calendar.advance(evaluationDate,-lag, ql.Months)
    convention = ql.ModifiedFollowing

    cpiTS = ql.RelinkableZeroInflationTermStructureHandle()
    inflationIndex = ql.USCPI(False, cpiTS)

    #last observed CPI level
    fixing_rate = 252.0
    baseZeroRate = 1.8


    inflationIndex.addFixing(fixing_date, fixing_rate)


    observationLag = ql.Period(lag, ql.Months)

    zeroSwapHelpers = []
    for date,rate in zciisData:
        nextZeroSwapHelper = ql.ZeroCouponInflationSwapHelper(rate/100,observationLag,date,calendar,
                                                              convention,dayCounter,inflationIndex)
        zeroSwapHelpers = zeroSwapHelpers + [nextZeroSwapHelper]

    # the derived inflation curve
    derived_inflation_curve = ql.PiecewiseZeroInflation(evaluationDate, calendar, dayCounter, observationLag,
                                                        inflationIndex.frequency(), inflationIndex.interpolated(),
                                                        baseZeroRate, yTS, zeroSwapHelpers,
                                                        1.0e-12, ql.Linear())
    cpiTS.linkTo(derived_inflation_curve)
    return inflationIndex, derived_inflation_curve, cpiTS, yTS

