3
$\begingroup$

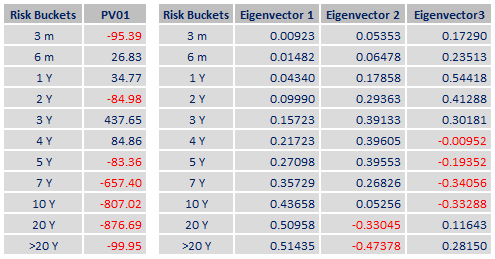
I have a portfolio of bonds and I have calculated their PV01 per risk bucket. The relevant buckets are 1m,2m,...,1y,2y,...30y; a total of 40 buckets.

I also run a PCA and have identified the three principal components. Someone said that it is possible to transform the 40 risk buckets to a smaller set of risk buckets with equivalent risk profile using the above PCA by a simple matrix multiplication.

I know it is a very vague statement but I can't figure out how this could happen.

Any hints/ideas?

Thank you in advance.Risk buckets and vectors

$\endgroup$
5
  • $\begingroup$ but what do you want this to give you in the end? what is the "thing" you want? $\endgroup$
    – jason m
    Commented Nov 5, 2019 at 23:59
  • $\begingroup$ Do a pca on the 40 columns of risk buckets? $\endgroup$
    – Benedict
    Commented Nov 6, 2019 at 4:50
  • $\begingroup$ @Jason: instead of monitoring all 40 buckets and their PV01's, reduce the number to a minimum (i.e 5) and have in mind that there are 5 tenors of the curve that have the major impact to the whole PV01. Then according to the curve movement I could have a proxy of the overall risk $\endgroup$
    – tgeorge
    Commented Nov 6, 2019 at 8:56
  • $\begingroup$ Hi tgeorge were you able to figure this out? Have the same question $\endgroup$ Commented Sep 24, 2021 at 4:56
  • $\begingroup$ What's a good reference on building that bucketed PV01 report? I have a portftolio of bonds and interest rate futures. $\endgroup$
    – SuavestArt
    Commented Feb 23, 2022 at 15:05

2 Answers 2

3
$\begingroup$

It is very simple to make a matrix transformation you simply have the structure:

$$ \begin{bmatrix} m_{11} & m_{12} & m_{13} & m_{14} & m_{15} & m_{16} \\ m_{21} & m_{22} & m_{23} & m_{24} & m_{25} & m_{26} \\ m_{31} & m_{32} & m_{33} & m_{34} & m_{35} & m_{36} \\ \end{bmatrix} \begin{bmatrix} s_1 \\ s_2 \\ s_3 \\ s_4 \\ s_5 \\ s_6 \end{bmatrix} = \begin{bmatrix} r_1 \\ r_2 \\ r_3 \end{bmatrix}$$

where $s_i$ are your initial risks (i.e. the buckets 1m ... 30Y) except in this case suppose that they are the buckets 5y, 6y, 7y, 8y, 9y, 10y,
and $r_i$ are your new (reduced) target buckets.

You can design the matrix, $M = {m_{ij}}$, in anyway you like, so let me suggest a very simple model initially:

Linear Interpolation

In this model the points 5y, 6y, 7y, 8y, 9y, 10y will be compressed to 5y, 7y and 10y, using linear allocation beside the adjoining points. Under this model we have the structure:

$$ \begin{bmatrix} 1 & 0.5 & 0 & 0 & 0 & 0 \\ 0 & 0.5 & 1 & 0.666 & 0.333 & 0 \\ 0 & 0 & 0 & 0.333 & 0.666 & 1 \\ \end{bmatrix} \begin{bmatrix} s_1 \\ s_2 \\ s_3 \\ s_4 \\ s_5 \\ s_6 \end{bmatrix} = \begin{bmatrix} r_1 \\ r_2 \\ r_3 \end{bmatrix}$$

The advantage of this model is that is stable and transparent.
The disadvantage is that it may not reflect the idiosyncratic movement of the curve.

PCA

In this model the rows of the matrix are the PC values and each risk bucket represents the risk to that component.

$$ \begin{bmatrix} ...PC1... \\ ...PC2... \\ ...PC3... \\ \end{bmatrix} \begin{bmatrix} s_1 \\ s_2 \\ s_3 \\ s_4 \\ s_5 \\ s_6 \end{bmatrix} = \begin{bmatrix} r_1 \\ r_2 \\ r_3 \end{bmatrix}$$

The advantage of this model is that measured over the historical sample period the greatest amount of variance of risk is captured by the 3 risk buckets.
The disadvantage is that it is specific to the historic period sampled and therefore is not static or necessarily reliable in the future, and it is very difficult to hedge a single PC risk bucket since you need to trade all instruments very precisely.

Non-Linear Curve

This has always been my favoured model and has been incredibly reliable and accurate for trading. Here the values $m_{ij}$ are functions of how the curve building process impacts each instrument under its interpolation scheme when either the 5Y 7Y or 10Y rate are adjusted. It will be a non-linear function.

The advantage of this model is that it will reliably offer a method to accurately hedge the risk with only the (fewer) sub sampled risk buckets.
The disadvantage is that it relies on a more complicated curve construction which is known to be reliable and the matrix values must be computed under a bumping/numerical process.

$\endgroup$
3
  • $\begingroup$ I'm not sure I understood what do you mean in PCA comment. I just added an example with real values. Can you elaborate? $\endgroup$
    – tgeorge
    Commented Nov 7, 2019 at 8:32
  • $\begingroup$ Take the transpose of your eigenvectors columns and that is matrix M. Do the matrix multiplication and the risk vectors, r, are the respective total risks to each component $\endgroup$
    – Attack68
    Commented Nov 7, 2019 at 9:00
  • $\begingroup$ But this calculation wll result to the risks of level, slope and curvature? Right? What I'm looking for is to transform the risks of the current vector to a vector with less tenors. How the calculation you propose will result to i.e a 5Y-7Y-10Y vector? $\endgroup$
    – tgeorge
    Commented Nov 10, 2019 at 17:24
2
$\begingroup$

I used to run a PCA model for >50 markets (global cross-asset) that we used to use to identify and quantify macro risk factors, so I know it can be done. We used to use it to objectively define "risk-on, risk-off", "the QE monotrade", "dollar-vs-EM&Commodityness" etc.

I'm no bond/rates expert, but I'm surprised you'd want to PCA Pv01 rather than eg the shape of the curve (ie levels) or yield/price moves (ie changes). Isn't Pv01 a sensitivity measure, basically already a function of duration? I'm not sure why you'd want to analyse duration vs f(duration); but happy to revise what follows in light of a good reason ;-)

The process formally is little more than pulling out the eigenvectors of the matrix of whatever you're trying to PCA. If you want to give each sample member equal influence in the model, you should use the correlation matrix. If you want to capture the maximum noise possible, use covariance.

To calculate the risk signals, the next step is to sum the product of each bucket's metric by its respective PCA weight (the eigenvectors). Or if using correlation, sum(metric * weight / metric vol). That was my multi-asset "risk-on". On a traditional curve model, it would be "duration". Etc.

Quick important check - run a correlation table of your PCA signals against each other. If it's not 1s on the diagonal and 0 everywhere else, something has gone wrong. If it is, but it doesn't make any sense, then you're accurately measuring something different from what you think you are or wish to measure. With this profile of factor independence, it's easy to do a ((X'X)-1)(X'Y) multiple regression of your original values against your risk factors, confident in the absence of multicollinearity issues.

What most people then tend to use PCA for is to use the dimensionality reduction to compare the broad sample against the "normal pattern" of the sample, often to highlight anomalies. I used to know with precision how much a +/-1 sigma shock to "risk-on" or "liquidity-off" was worth to the S&P, AUDJPY, HY CDX spreads or the German 2s10s curve. Or a classic rates PCA might suggest a level, steepness, and belly-vs-wings for the curve. Given these based on everything else, the 5y1y, the 3m7y, or the 11y2y should trade at X, Y, and Z respectively (vs actuals, which is what I'm obviously goigng to then flag up to my boss).

To recap: 1- think carefully about what you're actually seeking to measure, and why. Pick between correl and covar. 2- calculate the eigenvectors. 3- sum of these * values (standardised if correl) = risk factor value 4- check these are indepedent of each other 5- for each input, regression value vs risk factors 6- you now have an optimised description of your broad input universe based on as few dimensions as you desire.

happy to revise and explain if anything doesn't make sense.

$\endgroup$
4
  • $\begingroup$ Hi demully I already have an analysis to the three major components (level, slope, curvature). The idea behind is that instead of having remember my pv's to all tenors, what if i could have a three tenor approach (5,7,10 as attack suggests) and could have a quick calc of how a +/- 1 bp shock would affect my total pv. $\endgroup$
    – tgeorge
    Commented Nov 10, 2019 at 17:32
  • $\begingroup$ Then from the sounds of it, you've already done the hard work here! You have reduced all the dimensions of "interest rate risk" down to the three that really matter to you. You know what +/-1bp does on 10s or 5s10s etc. does to these 3 factors, which are independent so additive. And from these, you can predict what should happen to 1y2y, 3y6y, 8y etc. The portfolio impact is the sum of these times position size and current pv01 (without the need for additional PCA). $\endgroup$
    – demully
    Commented Nov 11, 2019 at 9:32
  • $\begingroup$ I suspect the confusion (at least mine personally) with the outputs above is that you happen to be eg paying 3s and receiving 2s? In which case, the Pv01s you're modelling are already a function of the portfolio's exposures. PCA on these would only really try to describe a pattern to the risks you happened to be running at present. Which is different from modelling the risk of your positions (and thus to the portfolio) of broad-sweep rate and curve shifts. $\endgroup$
    – demully
    Commented Nov 11, 2019 at 9:36
  • $\begingroup$ Now we get to my confusion: how can I reduce to the tenors I'm interesting?? So far, I have worked out the most granular level I could have i.e 3M->20Y. How can I collapse to the three buckets I want? Or four, or five.... $\endgroup$
    – tgeorge
    Commented Nov 11, 2019 at 15:44

Your Answer

By clicking “Post Your Answer”, you agree to our terms of service and acknowledge you have read our privacy policy.

Not the answer you're looking for? Browse other questions tagged or ask your own question.