Is there open-high-low-close data available at the daily timescale for yields? The data I can find from the Federal Reserve reports only one price, and moreover, I'm not sure when the data is reported. I know most bonds are not traded on exchanges, so it makes sense that this data is readily available, but I was wondering if this data was available anywhere.
-
1$\begingroup$ Selected TIPS yields are available on FRED: fred.stlouisfed.org/series/DTP10J28 $\endgroup$– Sergei RodionovCommented Mar 8, 2021 at 20:01
-
$\begingroup$ The 10 year's yield is available here barchart.com/stocks/quotes/V2Y00/price-history/historical though the past data looks a bit fishy $\endgroup$– nbbo2Commented Mar 8, 2021 at 22:52
3 Answers
MarketWatch daily OHLC bars for bonds yields are sourced from Tullett Prebon.
Here's a sample output for U.S. 10 Year Treasury Note yields in CSV format.
Date,Open,High,Low,Close
03/11/2021,"1.518%","1.554%","1.479%","1.538%"
03/10/2021,"1.532%","1.571%","1.506%","1.518%"
03/09/2021,"1.599%","1.599%","1.526%","1.596%"
03/08/2021,"1.568%","1.617%","1.568%","1.599%"
03/05/2021,"1.564%","1.614%","1.538%","1.568%"
The Closing interpolated yields are also available directly from the Treasury, in XML format, starting with 1997.
<m:properties>
  <d:Id m:type="Edm.Int32">7802</d:Id>
  <d:NEW_DATE m:type="Edm.DateTime">2021-03-08T00:00:00</d:NEW_DATE>
  <d:BC_1MONTH m:type="Edm.Double">0.04</d:BC_1MONTH>
  <d:BC_2MONTH m:type="Edm.Double">0.04</d:BC_2MONTH>
  <d:BC_3MONTH m:type="Edm.Double">0.05</d:BC_3MONTH>
  <d:BC_6MONTH m:type="Edm.Double">0.06</d:BC_6MONTH>
  <d:BC_1YEAR m:type="Edm.Double">0.09</d:BC_1YEAR>
  <d:BC_2YEAR m:type="Edm.Double">0.17</d:BC_2YEAR>
  <d:BC_3YEAR m:type="Edm.Double">0.34</d:BC_3YEAR>
  <d:BC_5YEAR m:type="Edm.Double">0.86</d:BC_5YEAR>
  <d:BC_7YEAR m:type="Edm.Double">1.28</d:BC_7YEAR>
  <d:BC_10YEAR m:type="Edm.Double">1.59</d:BC_10YEAR>
  <d:BC_20YEAR m:type="Edm.Double">2.2</d:BC_20YEAR>
  <d:BC_30YEAR m:type="Edm.Double">2.31</d:BC_30YEAR>
  <d:BC_30YEARDISPLAY m:type="Edm.Double">2.31</d:BC_30YEARDISPLAY>
</m:properties>
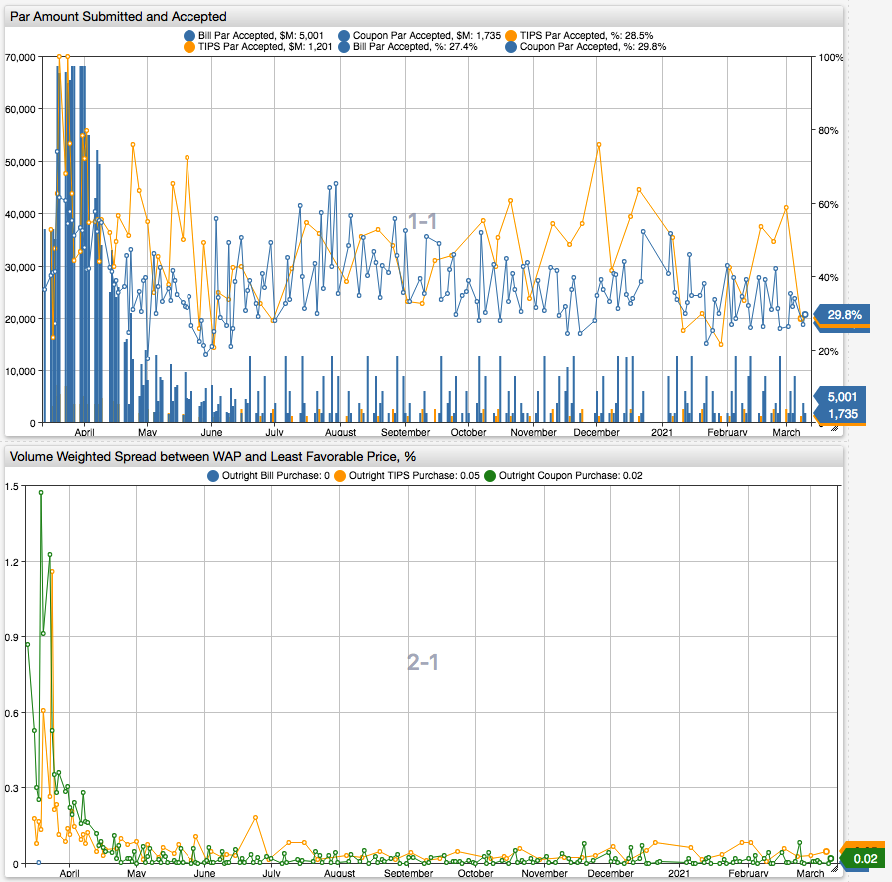
Another pricing source is the Treasury Securities Ops : Results : Excel : Weighted Avg. Accpt. Price/Rate (WAP) and Least Favorable Accpt. Price/Rate (LFP) columns. These two columns can be used as a measure of volatility in the bond market. For example, the volume-weighted spread between WAP and LFP showed signs of liquidity issues in the Treasury market during March 2020:
The peak day on the chart, March 19, was the day when Fed WAP for UST 2.875% 05/15/2049 during the day auction was 125.808 whereas LFP was 128.25390625!
The Excel Results files maybe delayed by several weeks, but the TSY API and the derived chart example above are more current. The volume weighted LFP/WAP spread is calculated as follows in SQL:
SELECT datetime, acc.entity AS "entity", acc.tags.operation_id AS "tags.operation_id", acc.tags.Operation_Type AS "tags.Operation_Type", acc.tags."Maturity/Call_Date_Range" AS "tags.Maturity/Call_Date_Range", acc.tags.operation_direction AS "tags.operation_direction",
  MAX(sub.value) AS tsy_submitted, sum(acc.value/1000000) AS tsy_accepted,
ABS(100*(SUM( acc.value*
  CASE
    -- Rounding per Note 1 https://www.newyorkfed.org/markets/desk-operations/treasury-securities
    WHEN acc.tags.operation_type IN ('Outright Bill Purchase', 'Outright FRN Purchase') THEN
      -- wap=1.516, lfp=1.5125, rlfp=1.513 pwap= 100/(1+wap/100) prlfp = 100/(1+rlfp/100) spread=100*(prlfp/pwap-1)
      (1+ROUND(lfp.value,3)/100)/(1+wap.value/100)
    ELSE
      -- wap=120.717 , lfp=120.7578125, rlfp=120.758 spread=100*(120.758/120.717-1)=0.0339637333598%
      ROUND(lfp.value,3)/wap.value
    END
  ) / SUM(acc.value)-1)) AS tsy_lfp_wap_spread
FROM "total_par_amt_submitted_($millions)" sub
   JOIN "par_amt_accepted_($)" acc
   JOIN "least_favorable_accpt._price/rate" lfp
   JOIN "weighted_avg._accpt._price/rate" wap
WHERE acc.entity = 'us.fed.nyc'
  AND acc.datetime BETWEEN today-14*day AND next_day
GROUP BY acc.entity, acc.tags.operation_id, acc.tags.Operation_Type, acc.tags."Maturity/Call_Date_Range", acc.tags.operation_direction, datetime
WITH TIMEZONE = 'US/Eastern'
ORDER BY datetime DESC, acc.tags.operation_id
-
$\begingroup$ This looks great! thank you so much $\endgroup$ Commented Mar 9, 2021 at 14:29
Bloomberg, Reuters (now Refinitiv), IDBs (ICAP used to sell rates/IRD data), trading platforms (e.g. BrokerTec, now part of CME)...this is only a partial list, I'm sure there are other sources.

