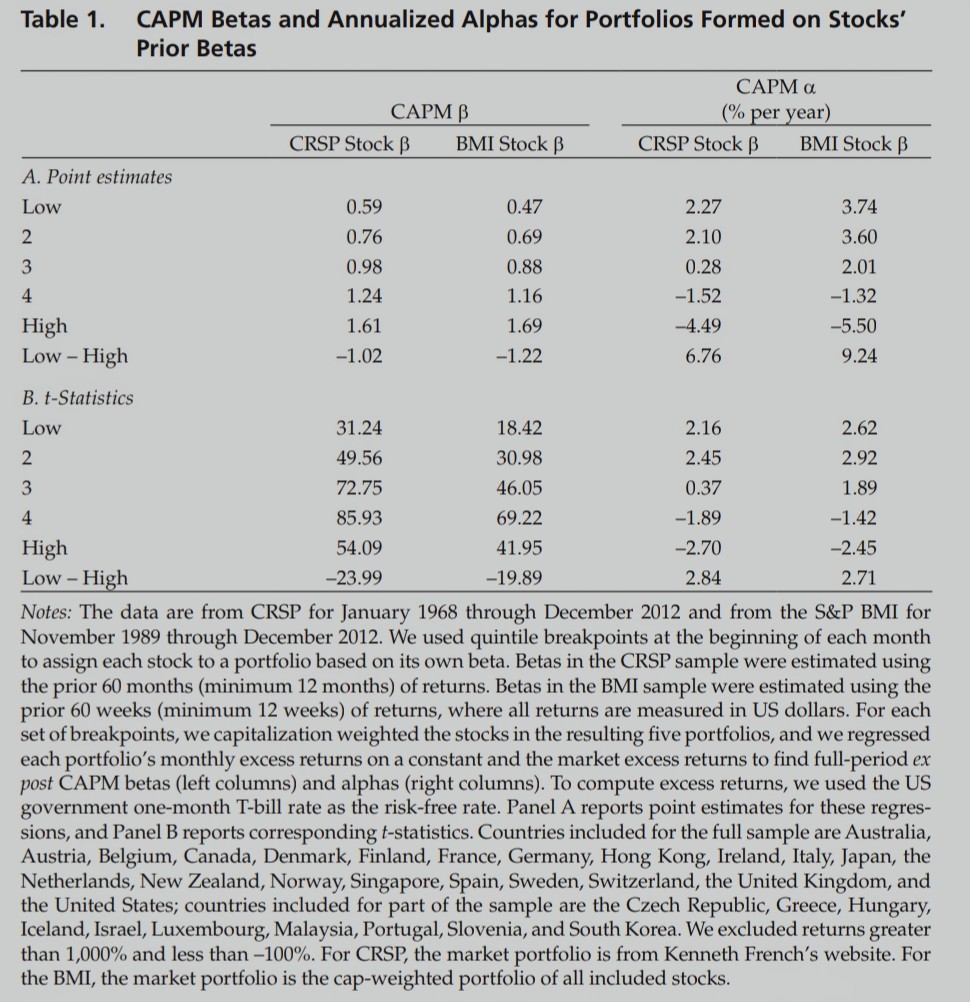
I would like to analyze the beta anomaly following the method used in the following paper "The low-risk anomaly: A decomposition into micro and macro effects" by (Baker et al, 2018). (the link: https://www.tandfonline.com/doi/full/10.2469/faj.v70.n2.2?needAccess=true)
I constructed the quintiles and ran the regressions, and subtracted the Low-High alphas as they have done in table 1 (panel A). However, in table 1 panel B they put the t statistics of the subtraction row (Low-High) which is something I did not understand how they compute it (the Low-High t statistics).  Anyone can help with this?
$\begingroup$
$\endgroup$
0
Add a comment
|
1 Answer
$\begingroup$
$\endgroup$
1
Yes. That is pretty easy. You have the returns for the high portfolio and for and low portfolio. You subtract one from the other and you have a time-series of returns for the High-Low portfolio. Then you just run the usual regression on that portfolio.
Hope this is clear.
-
$\begingroup$ Oh! that is so easy. Thank you so much for your help. $\endgroup$– SimaCommented Aug 29, 2022 at 17:40
