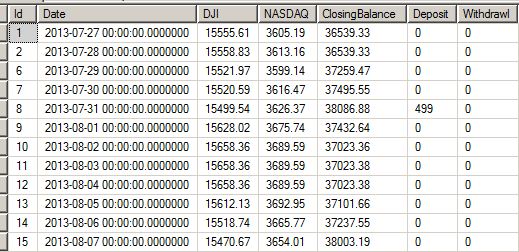
I come from a programming background and not am no quant by career so this is probably a newbie question for you guys. I have written some code to pull daily closing values for market indices (DOW/NASDAQ etc.) along with closing account balances from a stock broker's API.

So I have a date column, closing values for DJI/NASDAQ and 'ClosingBalance' for the day of a given trader's account. If I am to ignore the 'Deposit' and 'Withdrawal' columns, then I can take this time series and plot on a chart how the trader's account value is moving with the market for a given date range. I can then further compute if he is outperforming or not, etc. etc.
Great.
But turns out, the fellow might inject more equity via cash deposits over time or make withdrawals over time. Let's even forget withdrawals if it makes the scenario simpler, so in the case of just deposits (such as the 499 entry in the middle), what is the standard industry convention on adjusting against this while attempting to compute the trader's account balances vs. the market to see if he is outperforming?
Is it simple enough that when a deposit is made, you add up the same deposit for all previous days? And what happens when withdrawals are made?
Any hints on the usual direction programmers and quants take in this scenario will be helpful. Coding the logic isn't my problem, I want to understand what the practice to handle this situation is...
Also, how is the Y axis normalized here? The account balances could be in the 10k-100k range while the Dow could be in ther 15k-20k range while the NASDAQ could be in the 1k-5k range. Perhaps some kind of modular operation? Or divide or reduce by a factor? Perhaps pick one of the series' first value as the starting point on the scale, and subtract the other series by the difference so that all the series start at the same value? I suppose while plotting on a chart, the Y axis would really need to be a percentage scale and not absolute?...
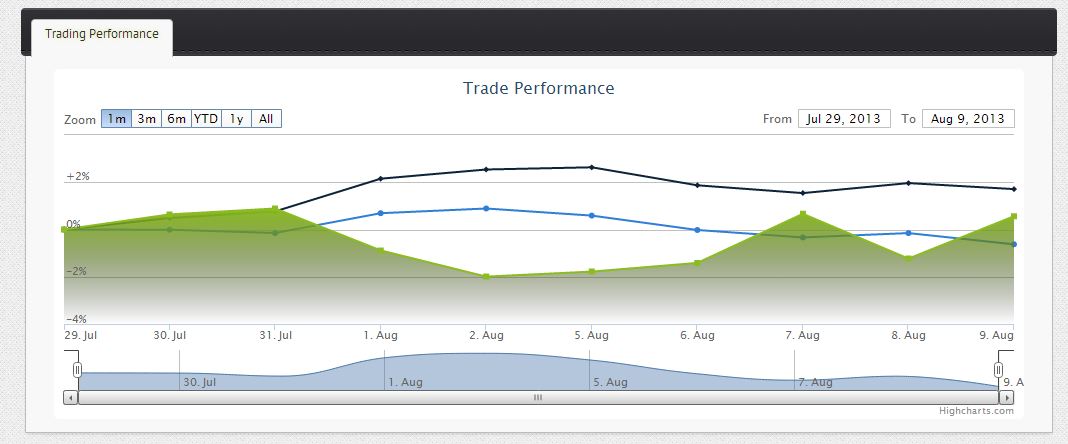
OP EDIT BEGIN - This is my first draft after I coded things up
The green is my fund performance, blue is the DOW, black is the NASDAQ.

OP EDIT END
Thanks!
