6
$\begingroup$

I am trying to calculate the implied volatility of an underlying given observed prices of call and puts. There are two scenarios:

  • The ATM strike is pinned by the market (i.e. underlying level == strike price)
  • The price of the underlying lies between two strikes

I have the following questions:

  1. How to combine the implied vols for same strike calls and puts
  2. How to interpolate between iVols for two strikes
  3. How to interpolate between iVols for calls and puts accross two strikes (Combination of 1 and 2 above)

Note: For the sake of simplicity, I'll assume that the options are European style, and I am using the BSM to backout the ivols.

[[Edit]]

I have changed the title to reflect the fact that it is a SINGLE (i.e. composite) value that I want to determine from the set of previously calculated IVols. Put simply, I want to know what is the most appropriate weighting scheme to apply, given the scenarios described above.

$\endgroup$

2 Answers 2

3
$\begingroup$

First, this question is barely on-topic because it's a very common topic and you can find the answer in basically any derivatives book.

However, the interpolation part is interesting so I'll give it a shot.

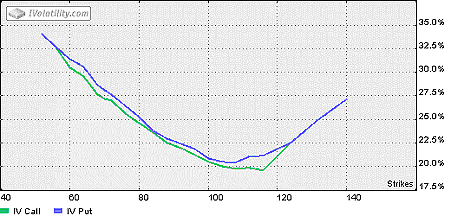
First of all, what you are actually trying to compute is called the Volatility Smile. It is basically a graph which shows the implied volatility of an option vs its strike price. So you get 1 smile for the calls, and 1 smile for the puts.

To compute the volatility, you basically have to run an algorithm which finds what $\sigma$ would have to be in order to get your pricing formula to give you the result which is provided by the market. For your setup,

$$\sigma_i=\underset{\sigma}{\arg\min} \quad (\text{BS}(\sigma,\theta)- \hat{c})^2$$

where $\hat{c}$ is the market price for the option with parameters $\theta=(K,S,T)$

The two volatility smiles

I do not think you should interpolate between the values obtained from the puts and the values obtained from the calls.

Between the nodes, you can use a Gaussian Kernel with a Kernel density estimation, I think it's quite an elegant way to get you complete line.

Finally, note that the fact that the smile are not equal for puts and calls, and that the graph are "smiles" and not "straight lines" demonstrate that the assumptions of the BS model are not supported by the market.

$\endgroup$
2
  • 1
    $\begingroup$ Thanks for your answer. Its not the smile that I want to calculate (as I mentioned earlier, I am working with only ATM options - so at the most, I am working with two strikes [if the underlying lies between two strikes]). I am looking to find a way to calculate a SINGLE number from the ATM calls and puts (using some kind of weighting). The more I think of it, since I am only dealing with two strikes at the most, a simple linear interpolation will do - although I may probably weight the vols by Open Interest $\endgroup$ Commented Mar 4, 2012 at 12:00
  • $\begingroup$ Well if you just want to compute the ATM strikes, you can use the values computed ATM on the smile using the formula I gave you. There should be no node, and you would have 2 implied volatilities, one for puts and one for calls, you can average them if you want, but I think they're more meaningful separated. $\endgroup$
    – SRKX
    Commented Mar 4, 2012 at 12:26
0
$\begingroup$

The more I think about this question, the more obvious it becomes to me (from a traders point of view) that both 'intra strike' and 'inter strike' averaging should be done by weighting by open interest - as this (open interest) is a measure of (putting it crudely), people "putting their money where their mouth is".

Unless there is a fundamental reason that makes sense from a practioners point of view, this is the way I will proceed. I find that sometimes the mathematics becomes too far removed from what actually happens in the markets.

$\endgroup$
1
  • $\begingroup$ I am very interested with your question. From trader perspective, I think it should be from the option midprice. Open Interest is just too subjective. One single big player can easily skew the result. $\endgroup$ Commented Mar 20, 2014 at 0:12

Your Answer

By clicking “Post Your Answer”, you agree to our terms of service and acknowledge you have read our privacy policy.

Not the answer you're looking for? Browse other questions tagged or ask your own question.