21
$\begingroup$

Here's an interesting trading puzzle that I would love to get the community's input on.

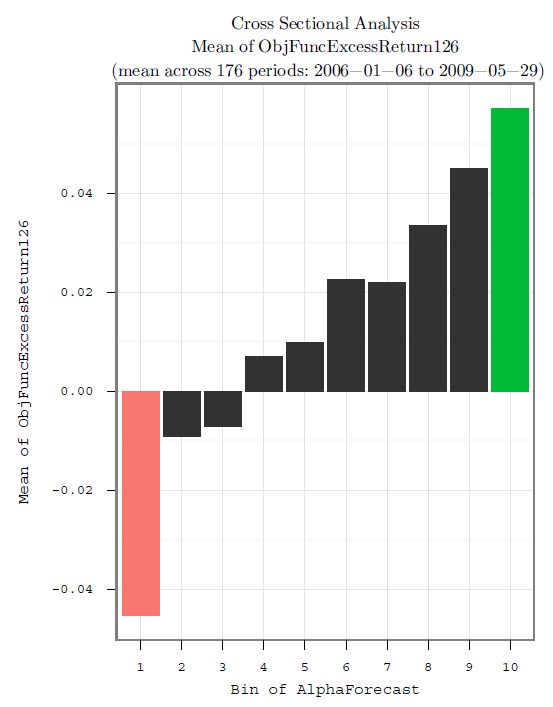
Let's say there exists an alpha signal that does a good job of sorting equities expected excess returns over some number of weeks. If we bin the alpha forecast into 10 equally sized frequency bins, we find that bin 1 has the lowest (and negative) mean realized excess return and bin 10 has the highest (and positive) mean realized excess return. The middle bins have middling risk-adjusted returns and there is nice monotonic pattern on average over non-overlapping periods as in the chart below:
enter image description here

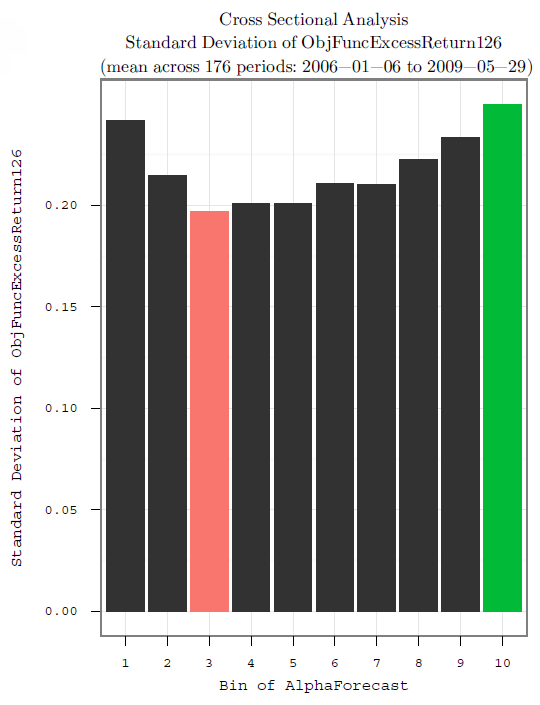
It also turns out that empirically the bins with smaller expected alpha also have lower realized volatility as depicted in this chart:
enter image description here

As you can see there is considerable variance of returns in any given bin that the mean summary metric obscures.

A typical market-neutral approach is to go long bin 10 and short bin 1, or simply drop all the forecasts into an optimizer since you have a nice monotonic pattern. That's all well and good but it leaves signal on the table. The weights produced via a typical approach will understandably not take significant large long/short positions in the middling bins despite the fact that there is considerable information in knowing that these securities have lower volatility and middling returns.

My question is how to best exploit the signal in the middling bins? How to best exploit the ability to separate securities by their expected realized volatility? For example, maybe one strategy is to generate premium income by writing straddles on the middle bins or somehow trade the volatility of one bin against another? It seems that the volatility on the tail bins are under priced, and the vol on the middle bins may be overpriced. Unfortunately, I do not have a similar chart showing the implied volatility for the various bins but they are all components of the S&P 500 so strategies relative to the Vix might be suitable.

Note, these are mean risk-adjusted excess returns (with respect to the S&P 500 benchmark) so total returns may be all positive or all negative during turbulent periods. Ideally, I'd like to avoid introducing market exposure, net market vol exposure, or other unhedged risks except for exposure to the alpha signals or realized volatility estimates themselves.

Thoughts?

$\endgroup$
5
  • 3
    $\begingroup$ This is an excellent question! All stat arb strategies I'm familiar with only trade the assets in the extreme bins; I've never thought to trade vol against the middle bins. $\endgroup$ Commented Apr 9, 2012 at 23:47
  • 1
    $\begingroup$ Thanks Chris! Stat Arb is a better way to frame the question - updated accordingly $\endgroup$ Commented Apr 10, 2012 at 1:38
  • 3
    $\begingroup$ Next time someone asks for a thesis topic, I'm going to refer him to this question. It's like buy-write for market-neutral investing. $\endgroup$ Commented Apr 10, 2012 at 1:55
  • $\begingroup$ Yes - exactly... I was thinking of buy-write as well $\endgroup$ Commented Apr 10, 2012 at 4:19
  • 2
    $\begingroup$ The straddle strategy would be relatively easy to put into your optimizer. Each straddle sold becomes an asset whose PL over the period is equal to the straddle price at initial market implied vol, minus the straddle price at realized vol. Reasonably skillful hedging will then make that PL realizable. $\endgroup$
    – Brian B
    Commented Apr 10, 2012 at 12:42

2 Answers 2

2
$\begingroup$

The implied volatility of an individual bin is not equal to the sum of the implied volatility of each stock in the bin.

As a result it becomes difficult to think in terms of a portfolio of options on the bins. Since it is difficult to get an estimate of the implied volatility of a bin, it becomes difficult to determine whether the volatility is over-priced or under-priced.

Nevertheless, if you had access to enough information it would be possible for an optimizer to crank out a portfolio that accounts for the full signal. For the sake of simplicity, assume that the length the equity is in the bin matches the horizon of the optimization. You would would need to model the risk-free rate and each equity and volatility surface in the bin (and probably the S&P500 as well for hedging). You would then simulate each distribution to the horizon and price all the relevant options using the future implied volatility. I would then form three portfolios, each with the same conditional Value at Risk and no net market exposure, given the: 1) base simulation, plus 2) views a la BL/EP for the returns of the bins, and finally 3) more views for the variances of the bins.

$\endgroup$
1
$\begingroup$

I am not sure why this seems a challenging question, so let me take a stab at it: So given I understand your presented data correctly in that past realized alpha ends on average up in the same bin as the expected alpha (implying co-integration between realized and expected excess returns). I make the assumption in the following that your excess returns are NOT volatility adjusted, but simply returns in excess of some benchmark rate (otherwise you should not call it alpha but Sharpe):

I would say the only motivation for anyone to trade the middle bins is the lower volatility. So, I would simply normalize the excess returns by volatility and then distribute the normalized results into bins again and then trade the extremes. Or, you may want to apply a different utility function in which volatility plays a role and which would result in you wanting to trade middle bins as well.

One needs to be careful to manage the balancing act of the distinction between realized volatility and realized alpha on one side and forecast volatility and expected excess returns on the other side. What I would find questionable in your question is that you give the impression away that you imply same future expected volatility than the measured realized volatility which is not correct as volatility is non constant. But for simplicity sake lets assume it is a good predictor of future volatility then I would go ahead with my suggested answer.

Otherwise the problem turns into something much more complex and you need more empirical data to warrant an accurate answer, meaning, I would need to ask you for expected volatility figures of the same stocks (I assume we are talking stocks here) in addition to their realized vols.

$\endgroup$
1
  • $\begingroup$ Agree with Matt's answer. My first intuition is to view the excess returns bins normalized with volatility and only consider the ones that are above a Sharpe threshold. $\endgroup$
    – hotsource
    Commented May 12, 2015 at 18:07

Your Answer

By clicking “Post Your Answer”, you agree to our terms of service and acknowledge you have read our privacy policy.

Not the answer you're looking for? Browse other questions tagged or ask your own question.