As a followup to this old question, Private Equity: Direct Alpha vs Excess IRR, I have a new one.
In automating PME calculations, the Direct Alpha (DA) approach is computationally simpler and eliminates the need to use a goal seek. However, we have historically used the Implied Private Premium (IPP) in reporting, so I've been researching the similarity and differences between the methods in the hope that I can move to the more automatable method.
This paper in particular proved to be illuminating and states the following:
Although both methods reconcile to the same PME IRR, the DA methodology calculates the IRR Spread geometrically, whereas the GEM IPP methodology calculates the IRR Spread arithmetically. In the GEM IPP paper, the authors demonstrate that DA is a special case of GEM IPP and that under continuous compounding, GEM IPP is equivalent to DA. As proven here, both methods will produce the same PME IRR.
The DA methodology has an advantage as it uses an IRR function, which for private equity is the industry standard. A disadvantage with the DA methodology is that the difference is geometric (which some may find confusing or counter-intuitive), although the arithmetic difference can simply be derived after the PME IRR is calculated. An advantage with the GEM IPP methodology is that the IRR Spread is arithmetic and easy to explain; however, the calculation is somewhat cumbersome.
It's not entirely clear to me how the arithmetic difference can "simply be derived", though I've managed to find some pretty decent approximations.
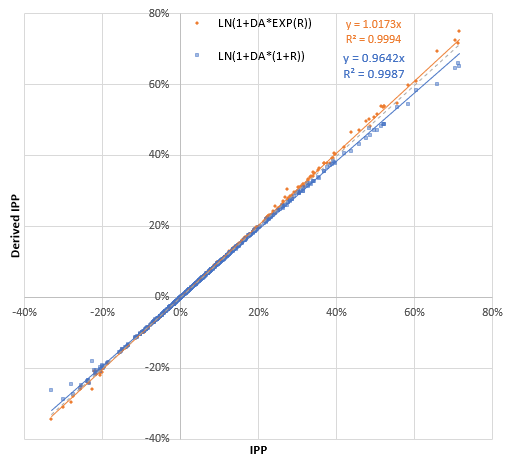
After computing the DA and IPP for several hundred return streams and comparing the results as a scatterplot, I experimentally came up with the following:
If DA = LN(1 + a) is the direct alpha with a being the IRR of the discounted cash flows according to its definition and R is the IRR of the unmodified cash flows, then IPP can be approximated by
LN( 1 + DA * EXP( R ) )
or similarly
LN( 1 + DA * ( 1 + R ) )
with the actual value of IPP usually between those two values.
This gets me better than 99% R^2 fit for reasonable IRR and alpha values, but I don't entirely understand exactly why or if there is a better conversion. Heuristically, I get why R is involved and that LN converts geometric to arithmetic, but I'm not quite understanding the details.
Mathematically, why does this work? Are there a more accurate or simpler conversions/approximations that I've overlooked?
I haven't had much luck searching for papers or articles that talk about deriving geometric values from arithmetic ones or vice versa. Any relevant references are welcome.
Edit:
I think I finally figured it out and it was simpler than I was thinking. I just had to go back and reread the paper.
Using these equalities from the paper:
PME = R - IPP
and
PME = (1 + R)/(1 + a) - 1
it's simple to solve for IPP in terms of a:
IPP = 1 + R - (1 + R)/(1 + a)
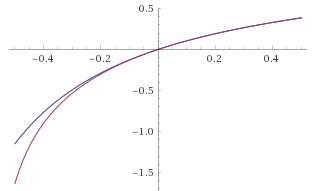
This matches up pretty well with my estimate above near the origin:


